

Mission Overview
A Spectroscopic Galaxy Evolution Survey with the Hubble Space Telescope (3D-HST)
Primary Investigator: Pieter van Dokkum
HLSP Authors: I. Momcheva, R. Skelton, K. Whitaker, G. Brammer
Released: 2014-09-03
Updated: 2026-09-25
Primary Reference(s): Momcheva et al. 2016, Brammer et al. 2012
DOI: 10.17909/T9JW9Z
Citations: See ADS Statistics
Source Data:
- Proposal ID: GO-12177 and GO-12328
- Source Data
3D-HST Figures
3D-HST pointings

Figure 1. Layout of the 124 3D-HST pointings. Primary WFC3 F140W+G141 pointings are shown in blue with the pointing ID numbers as defined in the HST Phase II file. The locations of the parallel ACS F814W+G800L observations are shown in light green. Also indicated is the distribution of the 28 pointings covering the GOODS-North field from program GO-11600 that are incorporated into 3D-HST. The light gray polygons indicate the footprint of the CANDELS WFC3 imaging, including both the “wide” and “deep” components of that survey. Note that the relative sizes of the separate fields are not shown exactly to scale. (Figure from Brammer et al. 2012).
3D-HERSCHEL

Figure 2. The star-forming main sequence (SFR vs. stellar mass) across four redshift bins for ~34,000 galaxies in the 3D-Herschel sample, derived from Prospector-β SED modeling. The solid blue line shows fits using UV-to-24 µm photometry alone; the red dashed line shows fits incorporating the full UV-to-350 µm 3D-Herschel photometry including Herschel/PACS+SPIRE constraints. The bottom panels show the difference between the two sets of fits. The close agreement across all redshift bins and stellar masses demonstrates that the 3D-Herschel catalogs provide independent FIR constraints on dust emission and star formation, enabling self-consistent panchromatic SED modeling across the full galaxy population, including robustly constrained dust emission parameters unavailable from UV-MIR data alone.
Overview
3D-HST is a near-infrared spectroscopic survey with the Hubble Space Telescope designed to study the physical processes that shape galaxies in the distant Universe (GO-12177 & GO-12328; PI: Pieter van Dokkum). This Treasury program was allocated 248 orbits of HST time during Cycles 18 and 19. 3D-HST is surveying ~600 square arcminutes of well-studied extragalactic survey fields (AEGIS, COSMOS, GOODS-S, UKIDSS-UDS) with two orbits of primary WFC3/G141 grism coverage and two to four orbits with ACS/G800L coverage. 3D-HST now provides the critical third dimension - redshift - for ~10,000 galaxies at z>1. This is the epoch when ~60% of the star formation in the Universe took place, the number density of quasars peaked, the first galaxies stopped forming stars and the structural regularity that we see in galaxies today emerged. The 3D-HST project details can be found in "3D-HST: A Wide-Field Grism Spectroscopic Survey with the Hubble Space Telescope", Brammer et al., 2012, ApJ, 758L.
The survey is optimally designed for the study of galaxy evolution over 1 < z < 3.5. The science objectives include: disentangling the processes that regulate star-formation in massive galaxies, evaluating the role of environment and mergers in shaping the galaxy population, and resolving the growth of disks and bulges, spatially and spectrally.
Observations
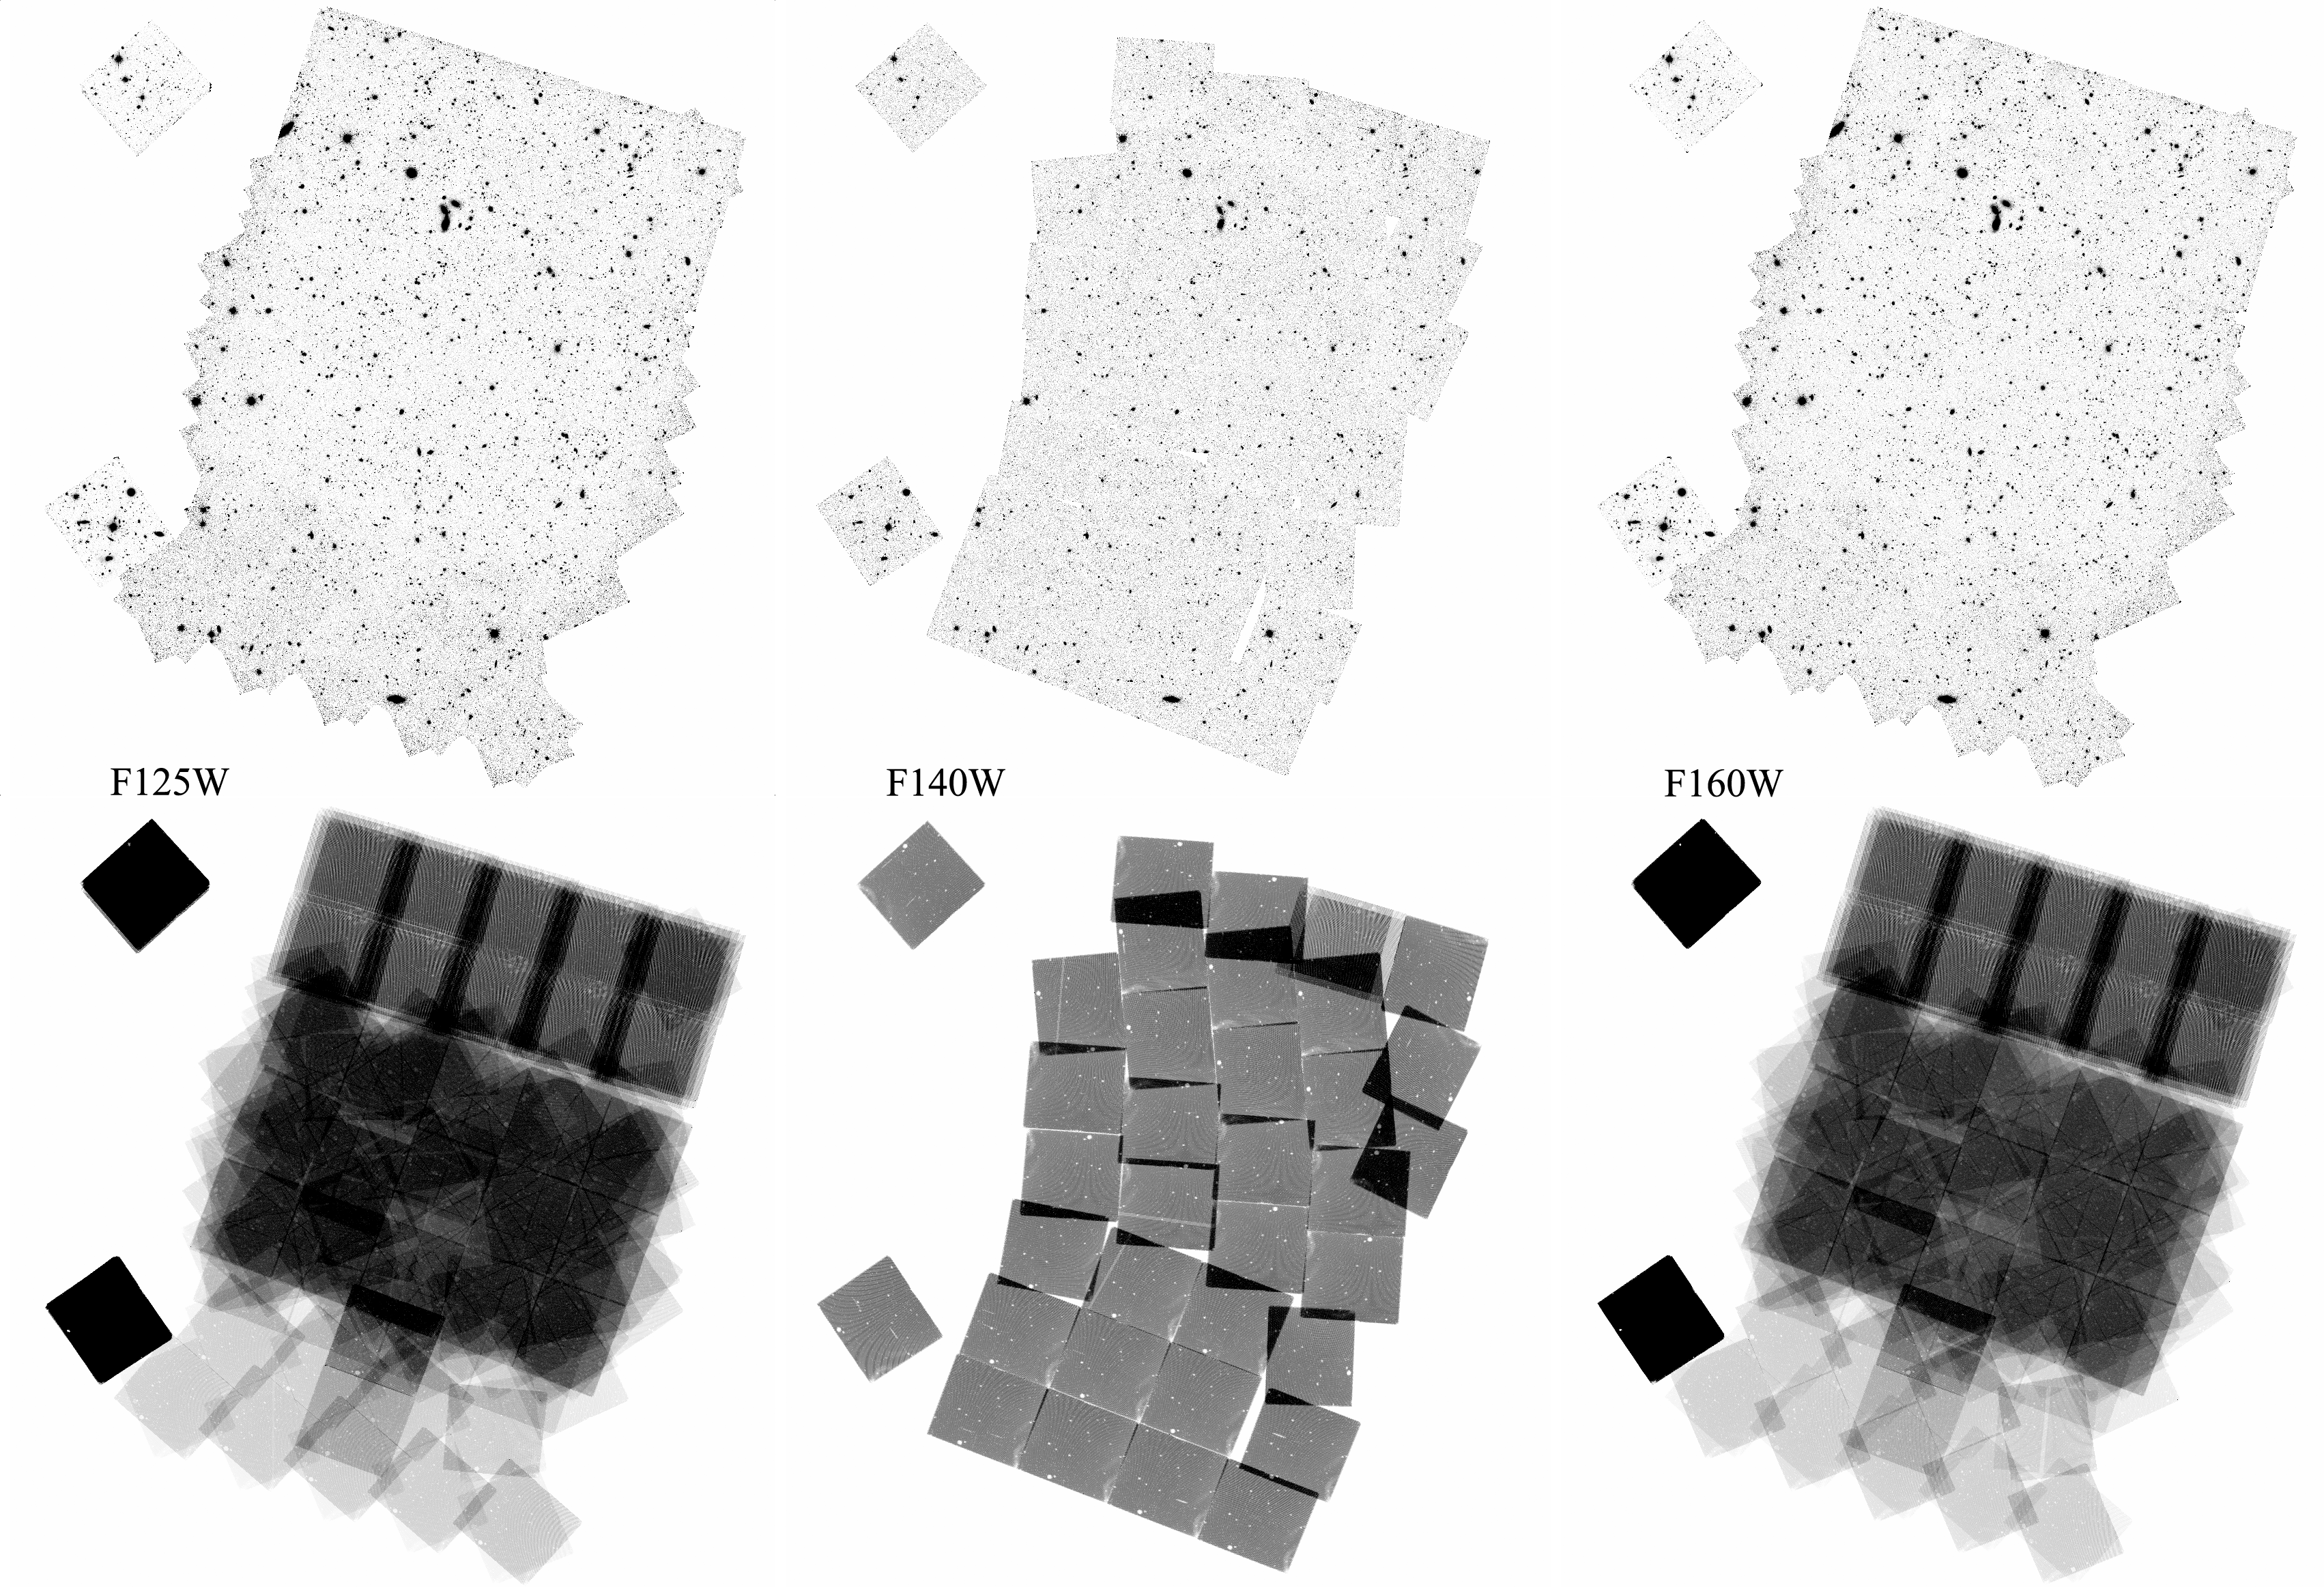
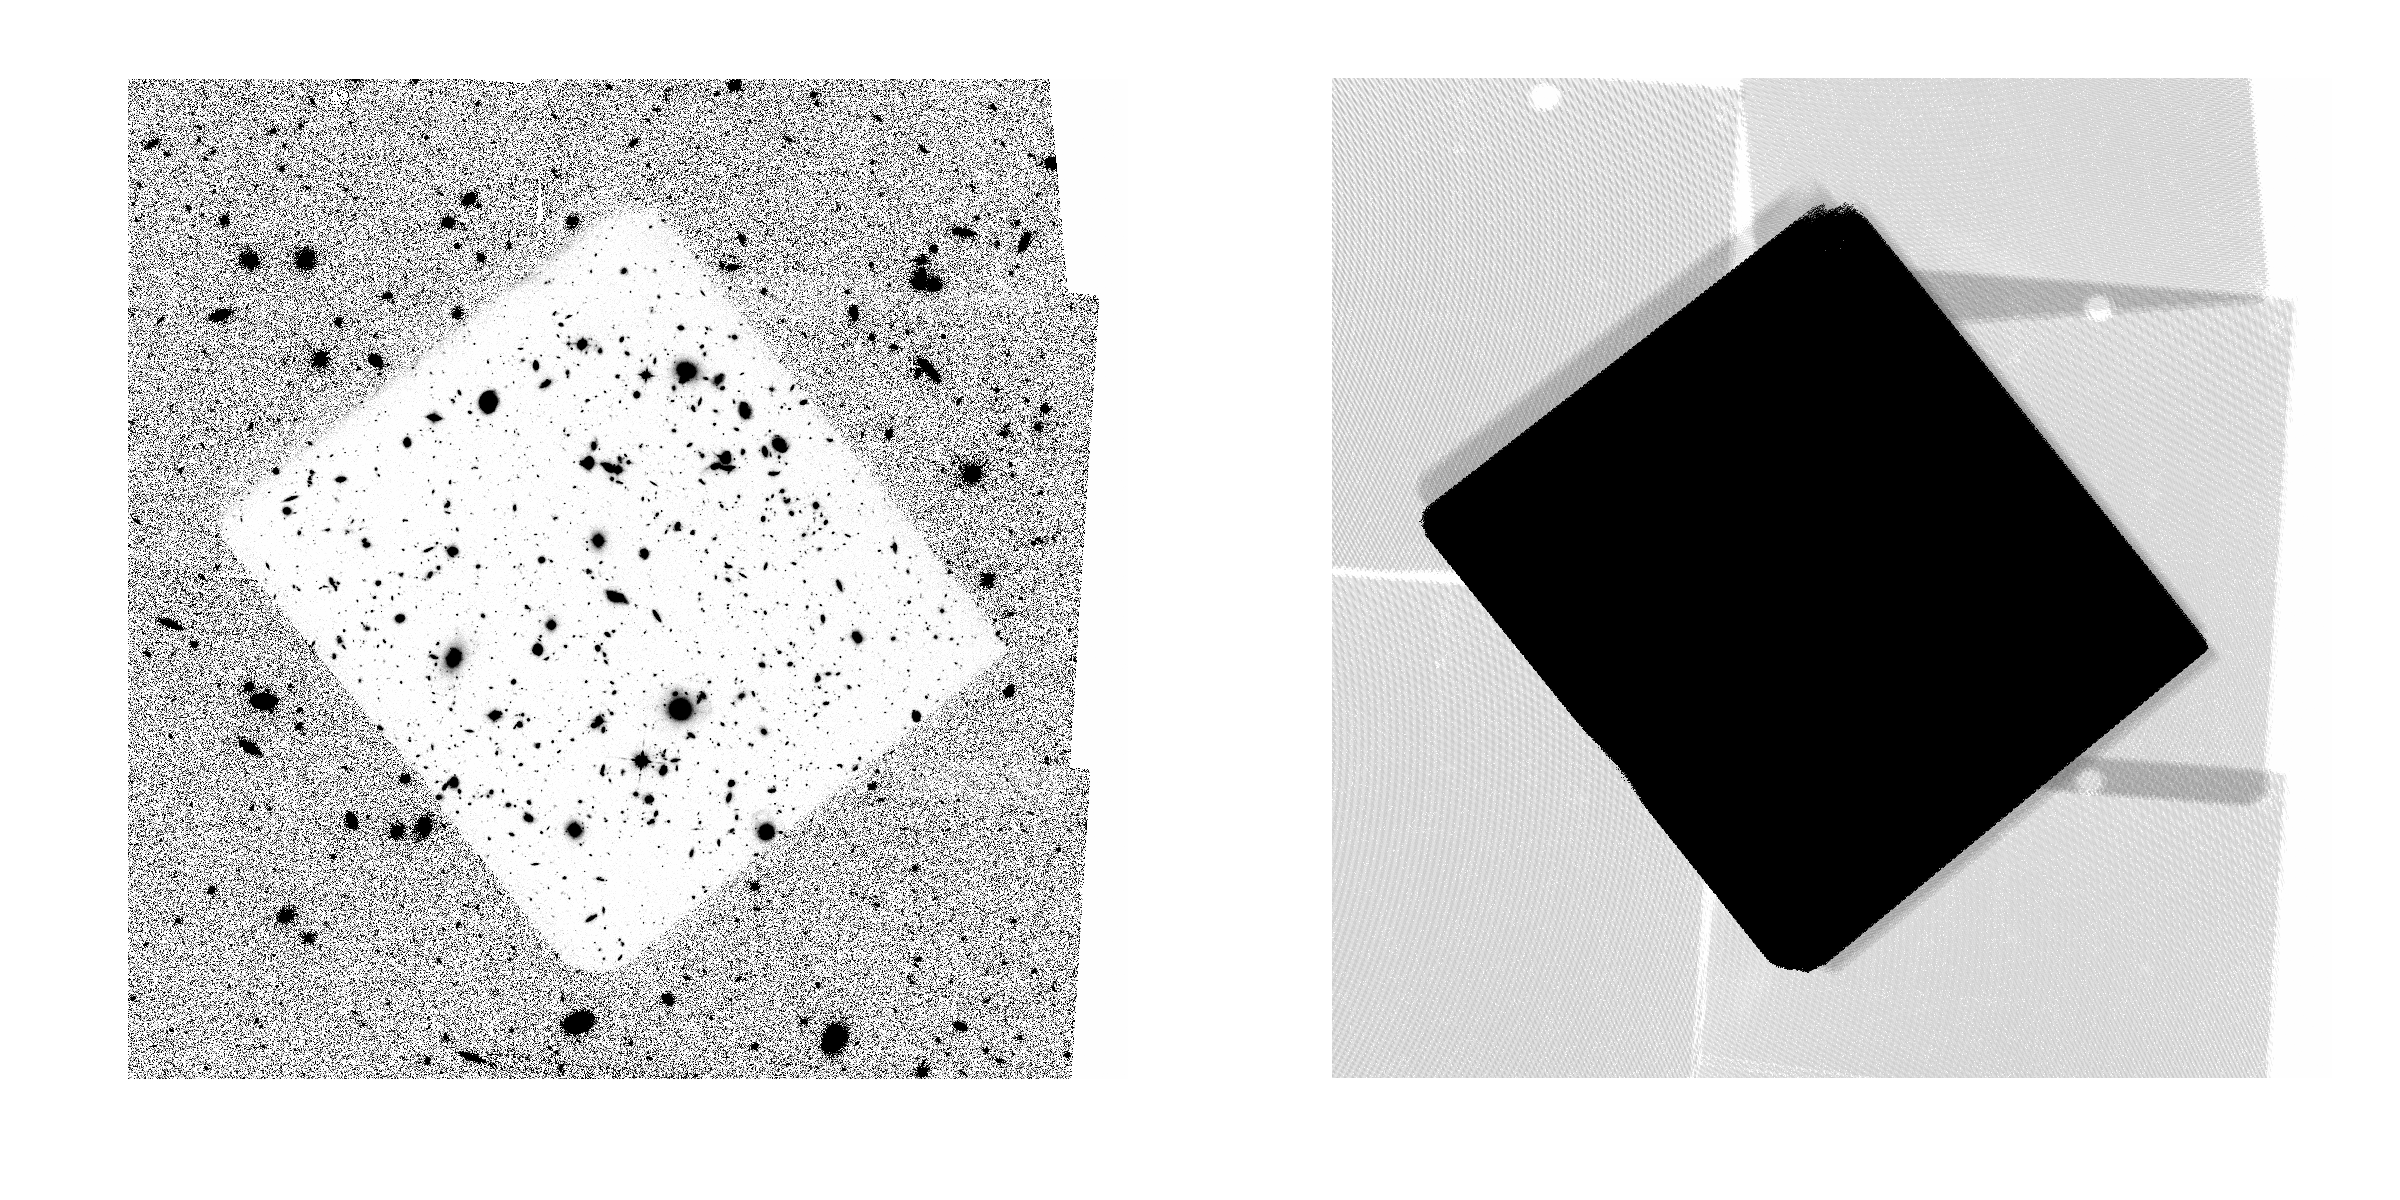
The 248 3D-HST orbits are divided among 124 individual pointings, each observed for two orbits (figure above and table below). In order to schedule 3D-HST concurrently with CANDELS observations of the same fields over Cycles 18 and 19, the orientations of the fields were determined only after the observations were scheduled. The positions of the individual pointings were optimized to provide contiguous mosaics and maximum overlap between the primary WFC3 G141 and parallel ACS G800L observations. Owing to this optimization, fully 90% of the G141 mosaic will be covered by between two and four orbits of the ACS grism. Within the GOODS-South mosaic, four of the two-orbit visits are centered on the Hubble Ultra Deep Field (HUDF) at the same orientation. The GOODS-South pointings outside of the area with CANDELS coverage provide WFC3 grism spectroscopy of the HUDF09 and WFC3-ERS fields.
| Field | Program ID | RA | Dec | N Pointings | Image | Region Files |
|---|---|---|---|---|---|---|
| AEGIS | 12177 | 14:19:31 | +52:51:00 | 30 | image | WFC3 / ACS |
| COSMOS | 12328 | 10:00:29 | +02:20:36 | 28 | image | WFC3 / ACS |
| GOODS-S | 12177 | 03:32:31 | -27:48:54 | 34 | image | WFC3 / ACS |
| HUDF | 12177 | 03:32:39 | -27:47:01 | 4 | image | WFC3 |
| UDS | 12328 | 02:17:26 | -05:12:13 | 28 | image | WFC3 / ACS |
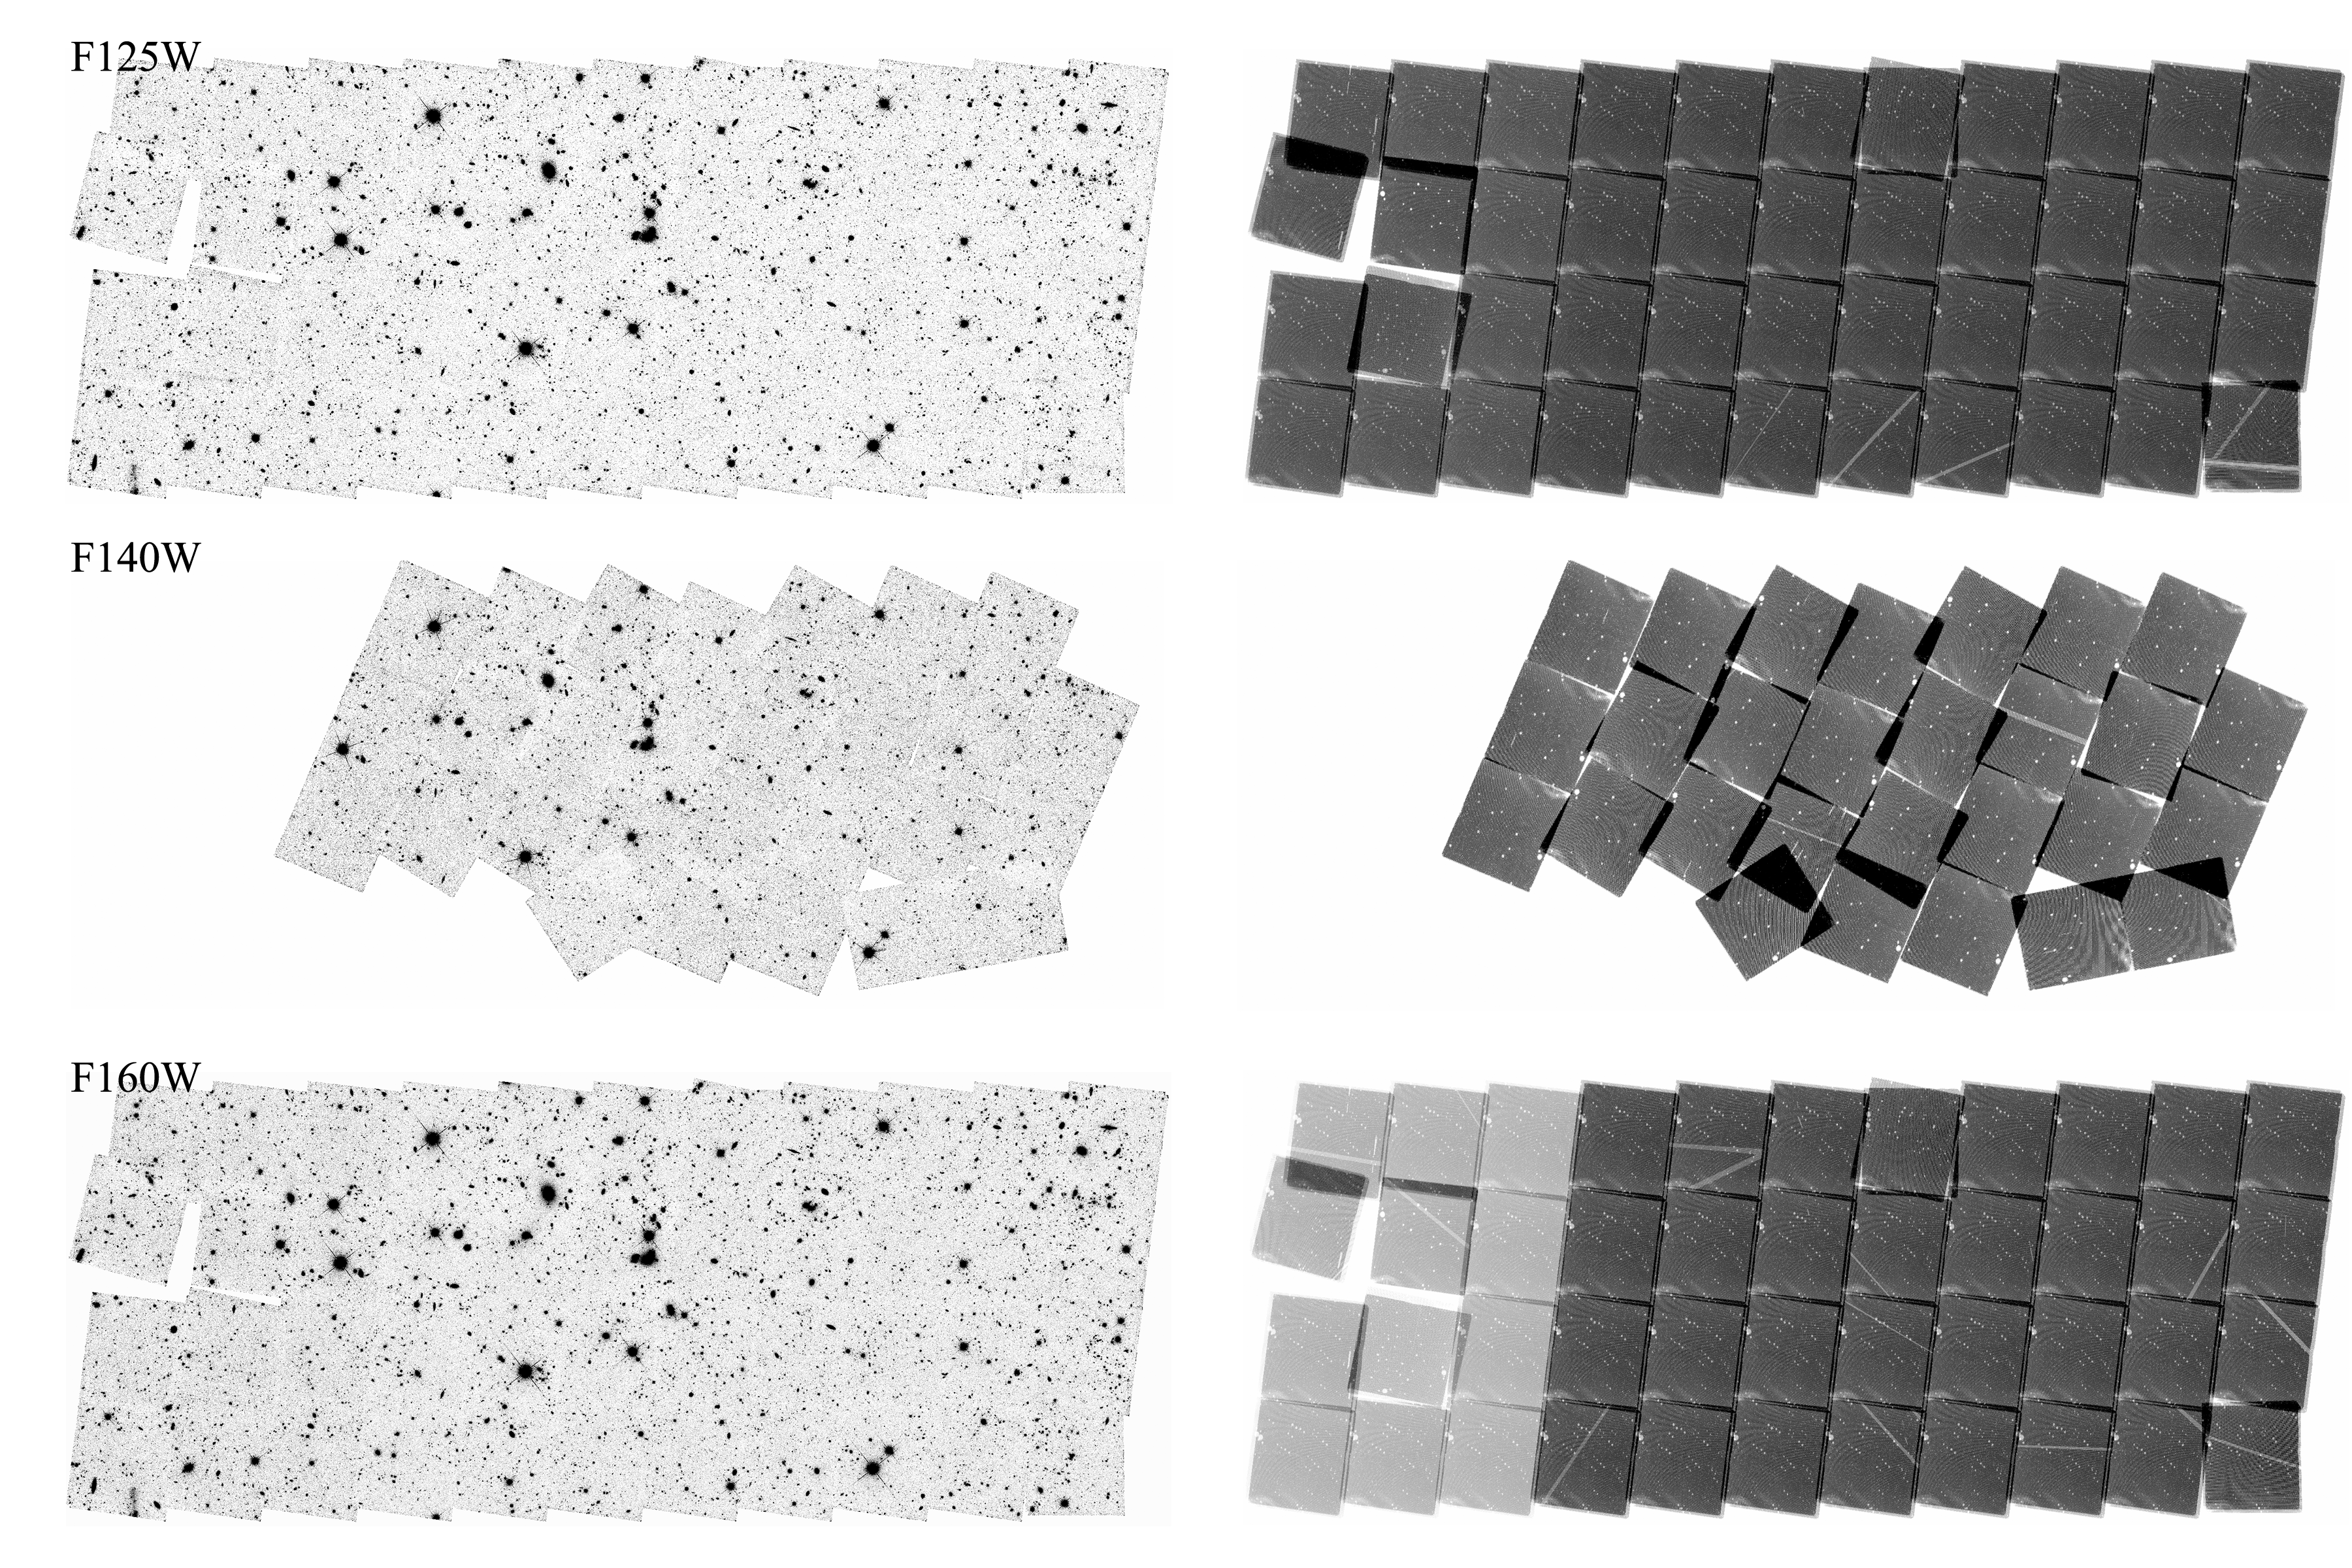
The 28-pointing G141 grism coverage of most of the GOODS-N field from program GO-11600 (PI: B. Weiner) is incorporated into 3D-HST, as the observational strategy of these observations are nearly identical to that of 3D-HST. There are GOODS-N mosaics and weight images (image | regions) in the F125W, F140W and F160W WFC3 bands. These mosaics are available as part of the 3D-HST V3.0 data release. The F125W and F160W observations were taken as part of the CANDELS survey. Parallel ACS grism observations are available from GO-13420 (PI: Barro).
Previous Data Releases
The v3.0 release described in van Dokkum et al (2013), including deep HUDF spectra, can be found here.
The preliminary data release v0.5 accompanying the survey paper Brammer et al. (2012) can be found here.
3D-Herschel Update
2026-09-25: The 3D-Herschel collection (McNulty et al. 2026) extends the CANDELS/3D-HST legacy photometric catalogs (Skelton et al. 2014) by adding deblended Spitzer/MIPS 24 µm and Herschel/PACS+SPIRE far-infrared (FIR) photometry spanning 70–350 µm across four extragalactic survey fields: COSMOS, GOODS-South, GOODS-North, and UDS. The resulting UV-to-FIR photometric catalogs cover 0.3–350 µm and preserve the source IDs of the original 3D-HST catalogs to facilitate cross-matching. Herschel photometry was obtained via a deblending approach using prior positions from the existing HST-based source catalogs, enabling FIR flux measurements for individual galaxies in the crowded far-infrared images.
In addition to the photometric catalogs, 3D-Herschel provides stellar population synthesis (SPS) catalogs for ~41,000 galaxies at 0.5 < z < 2.5, derived using an emulator trained to reproduce Prospector-β Bayesian SED modeling results (Leja et al. 2019; Johnson et al. 2021). Two sets of SPS catalogs are provided per field: one fit to the full UV-to-FIR photometry (UV-FIR), and one fit to photometry limited to UV-24 µm (UV-MIR). Including Herschel FIR photometry reduces the age-dust-metallicity degeneracy inherent in UV-MIR-only SED fitting, yielding more robustly constrained stellar masses, star formation rates, and dust attenuation properties.
Primary Investigator: Katherine E. Whitaker
HLSP Authors: Seamus McNulty, Mimi Song, Katherine E. Whitaker, Joel Leja, Aubrey Medrano, Elijah P. Mathews, Mark Dickinson, Hanae Inami, Ivo Labbe, Danilo Marchesini, Alexandra Pope, Irene Shivaei
Data Products
3D-HST
The final release of the 3D-HST dataset was made available in October 2015 on the 3D-HST website. This v4.1.5 release as well as the 2014 v4.1 photometric release are mirrored and archived here. It covers all five 3D-HST/CANDELS fields: AEGIS, COSMOS, GOODS-N, GOODS-S and UDS. See Momcheva et al. (2015) and Skelton et al. (2014) for full descriptions of the data and methods. The v4.1.5 release includes:
-
Extracted WFC3 2D and 1D spectra for ~250,000 objects
-
Redshifts based on joint fits to the grism spectra and photometry for ~100,000 objects down to JH=26
-
Emission line fits for to all major emission lines down to JH=26
-
Best redshift catalog combining the spectroscopic, grism and photometric redshifts in the five fields
-
Stellar masses, UV+IR star formation rates, rest-frame colors in 22 bands for the grism redshift and best redshift catalogs
-
Extracted ACS 2D and 1D spectra for ~25,000 objects
Data file naming convention:
hlsp_3dhst_<telescope>_<instrument>_<field>_<filter>_<version>_<product-type>.<extension>
where:
- <telescope> is the telescope used to obtain the data, for example "hst" or "spitzer"
- <instrument> is the instrument used in the observation, for example "wfc3" or "acs"
- <field> is the name of the target field, for example "aegis" or "cosmos"
- <filter> is the filter used in the observation, for example "f125w" or "f160w"
- <version> is the file version, for example "v4.0"
- <product-type> is the type of data product, listed in the table below
- <extension> is the file type: "fits", "tif", "pdf", etc.
Data product types:
| _sci.fits _orig-sci.fits |
Drizzled science image, created with the final processed FLT files |
| _conv-sci.fits | Convolved science image, PSF-matched to the F160W image |
| _wht.fits |
Drizzled weight map, created with the final processed FLT files |
| _exp.fits |
Exposure Map |
| _nexp.fits |
Number of exposure Maps |
| _psf.fits | Point Spread Function for each filter |
| _kernel.fits | PSF kernel images |
3D-Herschel
The 3D-Herschel files follow the naming convention:
hlsp_3d-herschel_<telescope>_multi_<field>_<wavelength>_v1.1_<product-type>.<extension>
where:
- <telescope> is the telescope used to obtain the data, for example "hst" or "herschel"
- <field> is the name of the target field, for example "goods-n" or "cosmos"
- <wavelength> is the approximate wavelength range of the catalog, for example "uv-mir" or "uv-fir"
- <product-type> is the type of data product: photometry catalog (phot-cat) or SPS catalog (sos-cat)
- <extension> is the file type: "fits" or "txt"
Data product types:
| _phot-cat.fits |
Photometric catalog: UV-to-FIR photometric fluxes from 0.3–350 µm, extending the 3D-HST UV-MIR photometry with Spitzer/MIPS 24 µm and Herschel/PACS+SPIRE far-infrared measurements. |
| _sps-cat.fits |
SPS catalog with Herschel (UV-FIR): Stellar population parameters (stellar mass, SFR, dust attenuation, and more) derived from Prospector-β SED fits to the full UV-to-FIR photometry. |
| _sps-cat.fits | SPS catalog without Herschel (sps-cat, UV-MIR): Stellar population parameters derived from Prospector-β SED fits to photometry limited to UV-24 µm, for comparison with Herschel-inclusive fits. |
Data Access
MAST Portal and Astroquery
The 3DHST imaging data products are available in the MAST Search Portal (web-based, cross-mission search interface) and Astroquery (Python package to search for and download files from Python scripts you write).
Note that only the imaging products are available through this method. For the catalog data and auxiliary files, please use the links in the "Direct Download" section below.
- In the MAST Search Portal, set the Provenance Name filter to "3DHST" in an Advanced Search to find these data. The user guide for how to search and download products using the MAST Portal is available here.
- For Astroquery, the following example code demonstrates how to search for and download these products. This code assumes that you want to download all products from this HLSP, so you may want to consider narrowing down your search for large HLSPs (> 10 GB) or those with many individual files (> 10k). You can find more astroquery.mast tutorials here.
from astroquery.mast import Observations
# Search for all 3DHST products
all_obs = Observations.query_criteria(provenance_name="3DHST")
data_products = Observations.get_product_list(all_obs)
# Print the number of data products that would be downloaded
print(len(data_products))
# Download data
Observations.download_products(data_products)
-
A web-based interface for cross-mission searches of data at MAST or the Virtual Observatory.
-
Search for and download data products for this HLSP programmatically in Python.




Direct Download
The data for this HLSP are available for direct download using the links in the tables below:
data-tables
-
Credit: When using the grism data products and derived parameters provided here, please cite Momcheva et al. (2015), Brammer et al. (2012) and include the following text: "This work is based on observations taken by the 3D-HST Treasury Program (GO 12177 and 12328) with the NASA/ESA HST, which is operated by the Association of Universities for Research in Astronomy, Inc., under NASA contract NAS5-26555."
Full documentation is available HERE. Regions files of the pointing layouts are available under Observations.
NOTE: Some of the downloads in this release are very large, occasionally exceeding 50 GB! If your internet connection is consistently excellent (~100 Mbpc), this download will take > 1 hour. We do realize that this is not the optimal way of distributing the dataset and are working on a database with an API interface. We hope to make it available soon.
FIELD CATALOGS WFC3 SPECTRA ACS SPECTRA ALL FIELDS MASTER CATALOG (92MB) AEGIS AEGIS CATALOGS (30MB) AEGIS WFC3 SPECTRA (49GB)
POINTINGS (~2GB each)
AEGIS FLT FILES (2GB)
AEGIS_ACS SPECTRA (17GB)
POINTINGS (~1GB each)
COSMOS COSMOS CATALOGS (26MB) COSMOS WFC3 SPECTRA (49GB) POINTINGS(~2GB each) COSMOS FLT FILES (2GB)COSMOS ACS SPECTRA (17GB) POINTINGS (~1GB each) GOODS-N GOODSN CATALOGS (29MB) GOODSN WFC3 SPECTRA (56GB) POINTINGS (~2GB each) GOODSN FLT FILES(2.5GB)GOODSN ACS SPECTRA (17GB) POINTINGS (~1GB each) GOODS-S GOODSS CATALOGS (37MB) GOODSS WFC3 SPECTRA (78GB) POINTINGS (~2GB each) GOODSS FLT FILES (2.6GB)GOODSS ACS SPECTRA (23GB) POINTINGS (~1GB each) UDS UDS CATALOGS (34MB) UDS WFC3 SPECTRA (58GB) POINTINGS (~2GB each) UDS FLT FILES (2.0GB)UDS ACS SPECTRA (17GB)
POINTINGS (~1GB each) -
Credit: When using the catalogs, derived parameters, and rest-frame colors provided here, please cite Skelton et al. (2014), Brammer et al. (2012) and include the following text: “This work is based on observations taken by the 3D-HST Treasury Program (GO 12177 and 12328) with the NASA/ESA HST, which is operated by the Association of Universities for Research in Astronomy, Inc., under NASA contract NAS5-26555.”
An up-to-date list of known issues is available HERE (also included in the full documentation).
FIELD DOWNLOAD TAR Read me ALL FIELDS ALL_TAR (200MB) (contains selected entries; see readme for details)
STAR-FORMATION RATES (8.7MB) (see Whitaker et al., 2014 for details)READ-ME AEGIS AEGIS_TAR (120MB) READ-ME COSMOS COSMOS_TAR (132MB) READ-ME GOODS-N GOODS-N_TAR (190MB) READ-ME GOODS-S GOODS-S_TAR (263MB) READ-ME UDS UDS_TAR (224MB) READ-ME -
All HST images used in the creating of the 3D-HST photometric catalogs are available for download.
Credit: When using the F140W mosaics provided here, please cite Skelton et al. (2014). When using the F125W and F160W mosaics, please cite Skelton et al. (2014), Grogin et al. (2011) and Koekemoer et al. (2011).
An up-to-date list of known issues is available HERE (also included in the full documentation)
-
All ground-based images used in the creating of the 3D-HST photometric catalogs are available for download.
When using images from other surveys, please cite the provided references.
An up-to-date list of known issues is available HERE (also included in the full documentation)
WARNING: The images in this section are based on publicly-available dataset. They are registered to the WFC3 mosaics above based on their header WCS and re-binned to a 0.06”/pix scale. Astrometric offsets and distortions exist between these ancillary images and the WFC3 images! Such offsets are accounted for in our photometric catalog, but the images are not corrected.
AEGIS Bands Data Telescope Survey Reference u,g,r,i,z AEGIS_u CFHT CFHTLS Erben et al. (2009); Hildebrandt et al. (2009) J1, J2, J3
H1, H2, KAEGIS_J1 KPNO/NEWFIRM NMBS Whitaker et al. (2011) J, H, Ks AEGIS_J CFHT/WIRCam WIRDS Bielby et al. (2012) 3.6, 4.5 um AEGIS_CH1 Spitzer/IRAC SEDS Ashby et al. (2013) 5.8, 8.0 um AEGIS_CH3 Spitzer/IRAC EGS Barmby et al. (2008) COSMOS Bands Data Telescope Survey Reference u,g,r,i,z CFHT CFHTLS Erben et al. (2009)
Hildebrandt et al. (2009)BJ, VJ, r+, i+, z+
12 medium-bandsSubaru Suprime-Cam Taniguchi et al. (2007)
Capak et al. (2007)J1, J2, J3
H1, H2, KCOSMOS_J1 KPNO/NEWFIRM NMBS Whitaker et al. (2011) J, H, Ks COSMOS_J CFHT/WIRCam WIRDS Bielby et al. (2012) Y, J, H, Ks COSMOS_Y Vista UltraVista McCracken et al. (2012) 3.6, 4.5 um COSMOS_CH1 Spitzer/IRAC SEDS Ashby et al. (2013) 5.8, 8.0 um COSMOS_CH3 Spitzer/IRAC S-COSMOS Sanders et al. (2007) GOODS-N Bands Data Telescope Survey Reference U GOODS-N_U KPNO 4m MOSAIC Hawaii
HDFNCapak et al. (2004) G,Rs GOODS-N_G Keck/LRIS Steidel et al. (2003) B,V,R,i,z GOODS-N_B Subaru Suprime-Cam Hawaii HDFN Capak et al. (2004) J, H, Ks GOODS-N_J Subaru MOIRCS MODS Kajisawa et al. (2011) 3.6, 4.5 um GOODS-N_CH1 Spitzer/IRAC SEDS Ashby et al. (2013) 5.8, 8.0 um GOODS-N_CH3 Spitzer/IRAC GOODS Dickinson et al. (2003) GOODS-S Bands Data Telescope Survey Reference U,R GOODS-S_U VLT/VIMOS ESO GOODS Nonino et al. (2009) U38,B,V,Rc,I GOODS-S_U38 ESO 2.2m GaBoDs 14 medium bands GOODS-S_IA427 Subaru Suprime-Cam MUSYC Cardamone et al. (2010) J, H, Ks GOODS-S_J VLT/ISAAC ESO GOODS Retzlaff et al. (2010)
Wuyts et al. (2008)J,Ks GOODS-S_J CFHT
WIRCamTENIS Hsieh et al. (2012) 3.6, 4.5 um GOODS-S_CH1 Spitzer/IRAC SEDS Ashby et al. (2013) 5.8, 8.0 um Spitzer/IRAC GOODS Dickinson et al. (2003) UDS Bands Data Telescope Survey Reference U UDS_U CFHT Megacam Almaini/Foucaud (in prep.) B,V,R,i,z UDS_B Subaru Suprime-Cam SXDS Furusawa et al. (2008) J, H, Ks UDS_J UKIRT WFCAM UKIDSS
DR8Almani et al. (in prep.) 3.6, 4.5 um UDS_CH1 Spitzer/IRAC SEDS Ashby et al. (2013) 5.8, 8.0 um UDS_CH4 Spitzer/IRAC SpUDS Dunlop et al. (in prep.) -
Credit: When using the catalogs provided here, please cite McNulty et al (2026), Skelton et al. (2014), Whitaker et al. (2014) and include the following text: “This work is based on observations taken by the 3D-HST Treasury Program (GO 12177 and 12328) with the NASA/ESA HST, which is operated by the Association of Universities for Research in Astronomy, Inc., under NASA contract NAS5-26555.”
The README file for the 3D-Herschel collection is available here: hlsp_3d-herschel_v1.1_readme.txt
FIELD Photometry Catalog SPS Catalog Read me COSMOS READ-ME GOODS-N READ-ME GOODS-S READ-ME UDS READ-ME
Code Examples
The authors of this HLSP have provided a few code examples for working with the data in Python, shown below.
Star-Forming Main Sequence with 3D-Herschel
Please find below a short Python tutorial demonstrating how to read and make a basic plot from the 3D-Herschel FITS catalogs:
import numpy as np
import matplotlib.pyplot as plt
from astropy.io import fits
from astropy.table import Table, join

# ── Load photometric catalog (FITS) ──
phot = Table.read('hlsp_3d-herschel_hst-spitzer-herschel_multi_cosmos_uv-fir_v1.1_phot-cat.fits')

# ── Load SPS catalog with Herschel (FITS) ──
sps = Table.read('hlsp_3d-herschel_hst-spitzer-herschel_multi_cosmos_uv-fir_v1.1_sps-cat.fits')

# ── Apply recommended use flag ──
matched_phot = join(phot, sps, keys='id', join_type='inner')
# ── limit phot cat to match sps cat on ID ──
use = matched_phot['use_phot'] == 1
phot = matched_phot[use]
sps = sps[use]

# ── Plot: star-forming main sequence ──
fig, ax = plt.subplots(figsize=(7, 5))

sc = ax.scatter(
    sps['survmass_50'],       # log stellar mass [log Msun]
    np.log10(sps['sfr100_50']),  # log SFR [log Msun/yr]
    c=sps['z_best'],
    cmap='plasma',
    s=1,
    alpha=0.4,
    vmin=0.5, vmax=2.5
)

cbar = fig.colorbar(sc, ax=ax)
cbar.set_label('Redshift', fontsize=12)
ax.set_xlabel(r'log $M_*$ [$M_\odot$]', fontsize=12)
ax.set_ylabel(r'log SFR [$M_\odot$ yr$^{-1}$]', fontsize=12)
ax.set_title('3D-Herschel COSMOS — Star-Forming Main Sequence')
ax.set_xlim(7.5, 12)
ax.set_ylim(-2, 2.5)
plt.tight_layout()
plt.savefig('3dherschel_mainsequence_cosmos.png', dpi=150)
plt.show()
Citations
Please remember to cite the appropriate paper(s) below and the DOI 10.17909/T9JW9Z if you use these data in a published work.
Note: These HLSP data products are licensed for use under CC BY 4.0.
When using data from the 3D-HST survey, please include the following acknowledgement:
| This work is based on observations taken by the 3D-HST Treasury Program (GO 12177 and 12328) with the NASA/ESA HST, which is operated by the Association of Universities for Research in Astronomy, Inc., under NASA contract NAS5-26555. |
- When using the grism data products and derived parameters provided here, please cite Momcheva et al. (2015) and Brammer et al. (2012).
- When using the photometric catalogs, derived parameters, and rest-frame colors provided here, please cite Skelton et al. (2014) and Brammer et al. (2012).
- When using the F140W mosaics provided here, please cite Skelton et al. (2014). When using the F125W and F160W mosaics, please cite Skelton et al. (2014), Grogin et al. (2011) and Koekemoer et al. (2011). When using images from other surveys, please cite the provided references.
- When using the 3D-Herschel catalogs, please cite McNulty et al (2026), Skelton et al. (2014), and Whitaker et al. (2014)