|
|||||||||||||||||||
|
|
|||||||||||||||||||
|
|
Colors/magnitudes: explanations and caveats
MAST is in the process of adding new ground-based survey colors and magnitudes for the Kepler Field of View; see below. Our executive summary is: for optical wavelengths that the UBV survey should be preferred over the KIS survey. However, both the KIS and and KIC magnitudes have suspected problems (e.g. at the bright end of the KIS magnitudes and for the (g-r) color; the extent of saturation issues for KIC has not yet been well determined); see the graphs page below. The few u magnitudes given in the KIC have been removed from our Target Search (but not from the still full KIC itself at MAST!) page because they are of poor quality. Users should plot KIC and KIS colors/magnitudes only with care: as they are based on different zeropoint magnitude systems (AB and Vega/Johnson). The reference for the AB system is Oke, J.B. and Gunn, J. 1983, ApJ, 266, 713O, and for the Johnson/Vega system Johnson & Morgan (ApJ, 117, 486, 1953J.
We give a link for the rules connecting survey acronyms with the filter magnitude names. You should also know that because of the zeropoint differences for the magnitude systems MAST will minimize the combinations of optical magnitude systems in the following way: colors formed using a filter from one KIC/KIS/UBV survey and a second filter from another catalog. Therefore, because we represent no mixed colors, e.g., (g_KIS - r_KIC), the only gr colors represented will be understood to be either gr (KIC) or gr_KIS.
Finally, we do not comment on the Hα equivalent widths in the KIS survey, which are parameterized by the rHα KIS index. A useful reference on the calibration of this index is Drew et al. 2005, MNRAS, 362 753D, or to the corresponding nonproprietary arXiv site.
Additional Magnitude Surveys
Here is a table that gives relevant information about the ground based
(and GALEX) surveys that we have added to the Colors Table database.
SURVEY NAME | AREAL COVERAGE | ZEROPOINT SYSTEM | MATCHING RADIUS | SUGGESTED MAG RANGE |
|---|---|---|---|---|
GALEX (NUV, some FUV) |
~1/2 |
AB |
2.5" |
-- |
2MASS (J,H,K) |
(selected objs.) |
Vega |
1" |
-- |
UK_IRT (J-magnitudes) |
full |
AB |
1" |
10-20 |
INT/KIS (U,g,r,i, Hα) |
~1/2 | Vega |
1" |
-- |
UBV (Everett et al.) |
full |
Vega |
1.5" |
12 to ~16.5 (soft) |
The Kepler Isaac Newton Telescope Survey (KIS) and
Everett (UBV) surveys are described in Greiss et al. 2012, AJ, 144, 24G
(arXiv) and
Everett, Howell, &
Kinemuchi 2012, PASP, 124, 316E
(arXiv).
Although the magnitude system for the KIC magnitudes (SDSS wavelength filters) is AB, note that the KIC catalog uses 2MASS magnitudes, which are based on the Vega system.
In our table we explicitly post suggested magnitude ranges where the authors recommend them in their paper (Greiss et al.) or privately to MAST (UKIRT).
Finally, we give the matching radius between the KIC and other catalogs. For matching radii among different non-KIC catalogs, one can generally use the linear sum of the two matching radii with respect to KIC given in the above table. However, the best recourse for interested users in this number is to check the empirical ranges ("examples/valid values") column of the Field Descriptions page.
At some points in the future MAST plans to bring in new colors from SDSS General Release 9 (Sloan ugriz; perhaps late fall, 2012), Part 2 of the KIS, and PanStarrs.
Filter transmissions
INT/ING/KIS filters (UgriHα) link here.
Select the Hα, U (RGO) or g, r, i (Sloan-Gunn) filters in various ascii
and image formats.
Similarly:
SDSS project (ugri) link here.
UBV link here. (Select the first three rows in the table.)
Filter transmission curves may be accessed via the links below for the KIS, Sloan and UBV filters to a table (first three tabular entries):
Graphs (magnitude scattershots)
The graphs below plot only a subset (typically 5-10%) of the
available data; we plot a subset so as not to cause "bleeding"
across the plot that can
and confuse the reader.
1) u (uKIC) vs. UKIS Plot

The uKIC vs. UKIS-magnitude scatter plot shows 3-4
parallel sequences each offset from the 1:1 relation with KIS magnitudes but
distributed over a range of 1½ magnitudes. For this reason the authors
of the KIC catalog have asked MAST to withdraw their u-magnitudes (only
2092 objects) from the Target Search pages. They may still be accessed
via the MAST/KIC web page, but we doubt that they are useful.
2) g vs. gKIS Plot
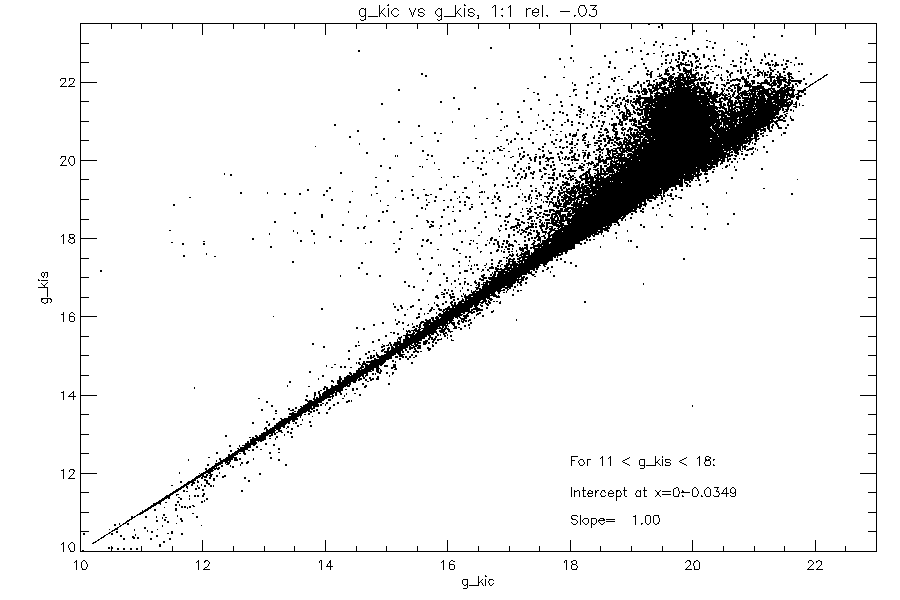
We find an offset of -0.03 magnitudes. However, the offset disappears
when one accounts for the zeropoint differences between the KIS (Vega)
and KIC(AB) systems, as given by
Gonzáles-Solares
et al. (2011, MNRAS, 416, 927) as:
Here AB referred explicitly to observations by the SDSS/DR8 in other regions
of the sky. However, in principle it could apply to other AB-based systems,
such as the KIC. If we adopt an average color from our sample
This plot and the r and i scatter plots disclose two other points that are
more bothersome. At faint magnitudes (> 16-17, depending on the filter)
a faint, nonparallel secondary sequence develops. We will show evidence
below that the secondary magnitude sequence is a problem with the KIC data.
At bright magnitudes (mKIS < 12) the KIS magnitudes are too
bright. Greiss et al. were aware of this problem for <12 KIS objects and
ascribed it to partial saturation of images. Note, however, the KIS "class"
value for saturation is only used for a minority of objects in the range
10-12th magnitude.
3) r vs. rKIS Plot
4) i vs. iKIS Plot
5) UKIS vs. UUBV Plot (where U represents
UUBV)
6) gKIS vs. B Plot (where B represents BUBV)
where the g and r magnitudes are meant for SDSS but could as well correspond
to the KIS survey. Taking a mean value of <(g-r)KIS> = 0.67,
Jester's relation predicts an intercept of 0.42 magnitude, which
agrees very well with our value of 0.41.
The turn-up of the sequence at bright filters appears is
the reflex of the turn-down noted above for the gKIC vs.
gKIS plot.
7) rKIS vs. V Plot (where V represents VUBV)
where all quantities are in the Vega system. Assuming <(B-V)> = 0.56 for our
population, we find a close correspondence with our intercept of 0.33
to the predicted offset of 0.35 mags. A turn-up is again visible
at the bright magnitude end of the relation, casting doubt on the reliability
of KIS magnitudes at the bright end, an issue that Greiss et al. noted.
b) (g-i)KIC vs. (g-i)KIS Plot
c) (r-i)KIC vs. (r-i)KIS Plot
d) (U-g)KIS vs. (U-B) Plot (where U and B refer to UBV)
e) (g-r)KIS vs. (B-V) Plot
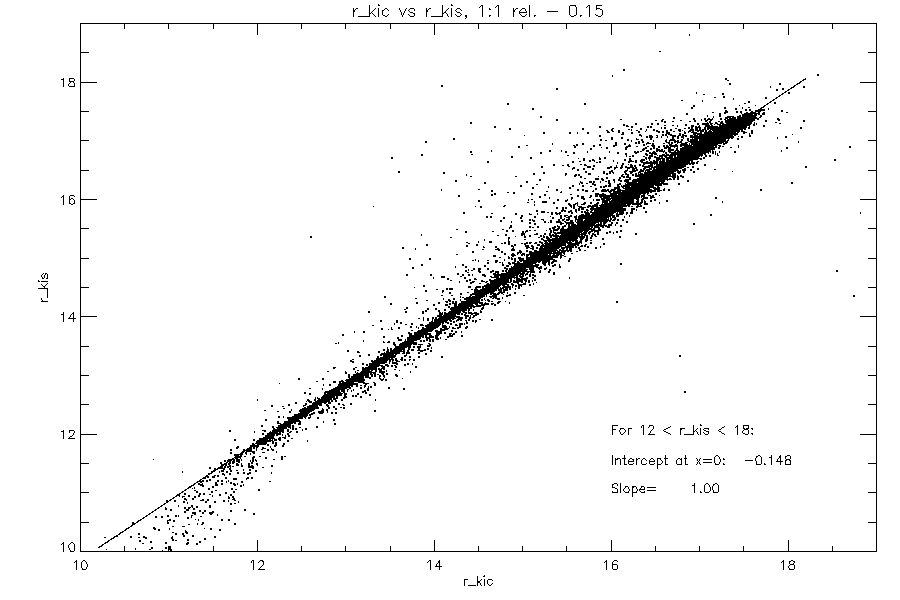
Likewise, the offset in the r magnitude scatter plot of -0.15 altogether
vanishes when an average color 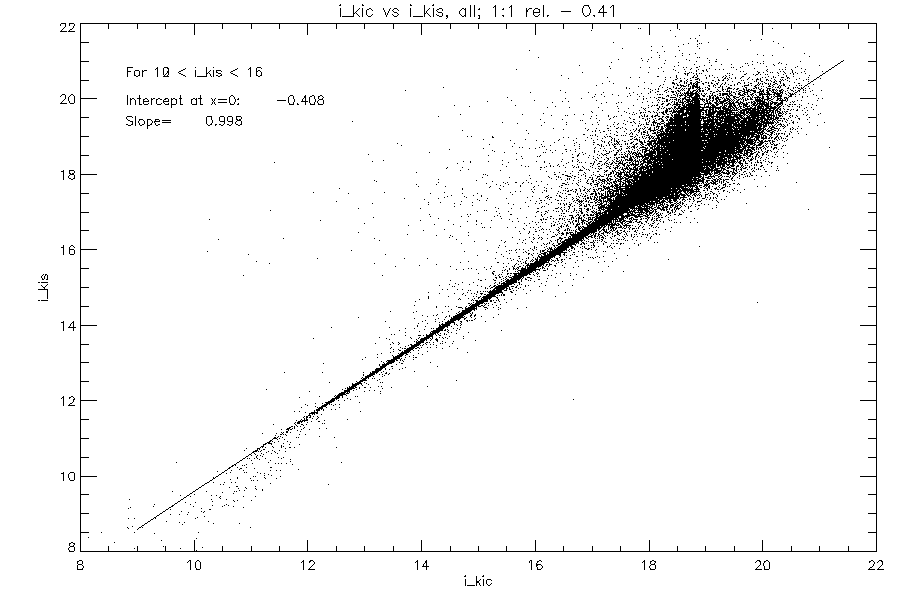
Again the seemingly large offset of -0.48 magnitudes is largely due
to the zeropoint difference between the KIS (Vega) and KIC
(AB) magnitude systems, namely:
Given a mean value <(r - i)> = 0.35 for our population, the predicted
offset is -0.44, which differs by -0.03 mags. from the value given in
our plot.
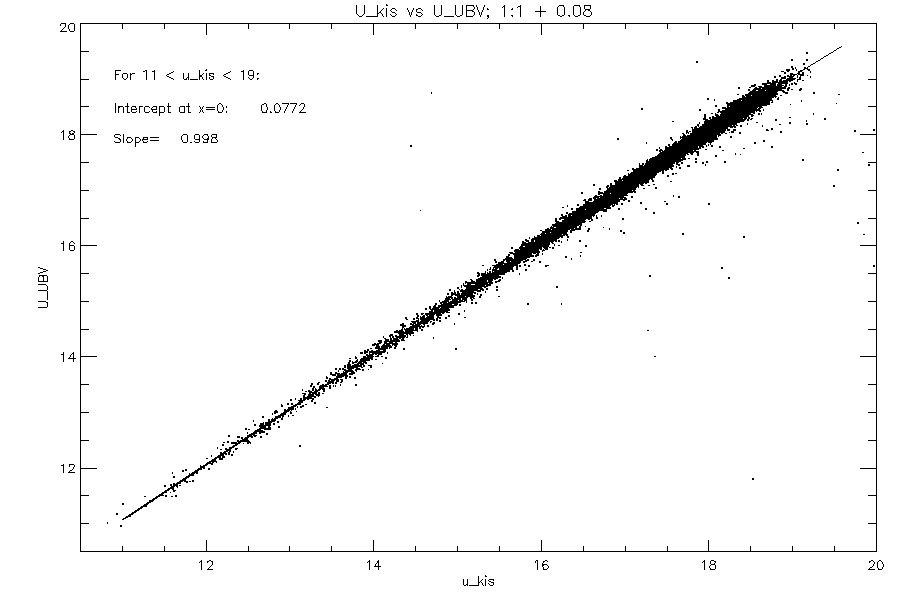
This figure shows an excellent relation between the U magnitudes in the KIS
and UBV/Kitt Peak system. The latter was adopted for the Everett et al. study.
There is a shift of about +0.08 (i.e., in the sense that
KIS is too faint). This is a sizeable discreprancy. There is reason to believe
that the KIS zeropoint is suspect, first, because the authors state that the
KIS survey's U filter suffered physical problems that compromised its results.
Second, they adopted a
zeropoint correction from their g-magnitude system - a guess which cannot be
expected to be accurate. MAST will eventually provide SDSS u-magnitude data
for the Kepler field which should help decide which is the better zeropoint.
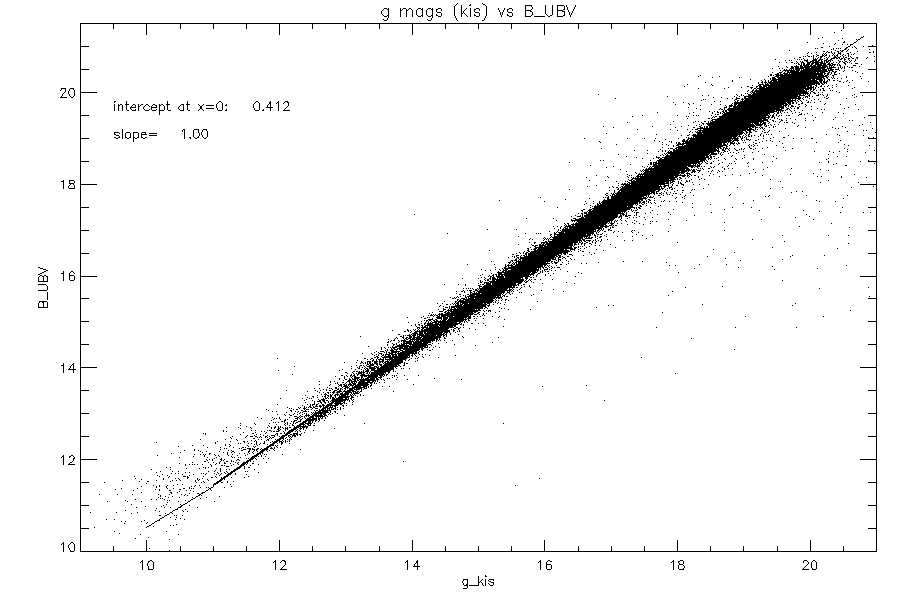
This scatter plot shows an excellent general correlation of the
magnitudes in the blue-green filters of the UBV and KIS systems. For
example, there is no secondary sequence at faint magnitudes. This shows
that the spurious feature is inherent in the KIC g, r, and i magnitudes.
In addition, the slope is 1.0,
which was also found in a study by Jester et al. (2005, AJ, 130, 873) for
AB-based g magnitudes observed in the SDSS survey. In fact Jester et al.'s
mean relation is: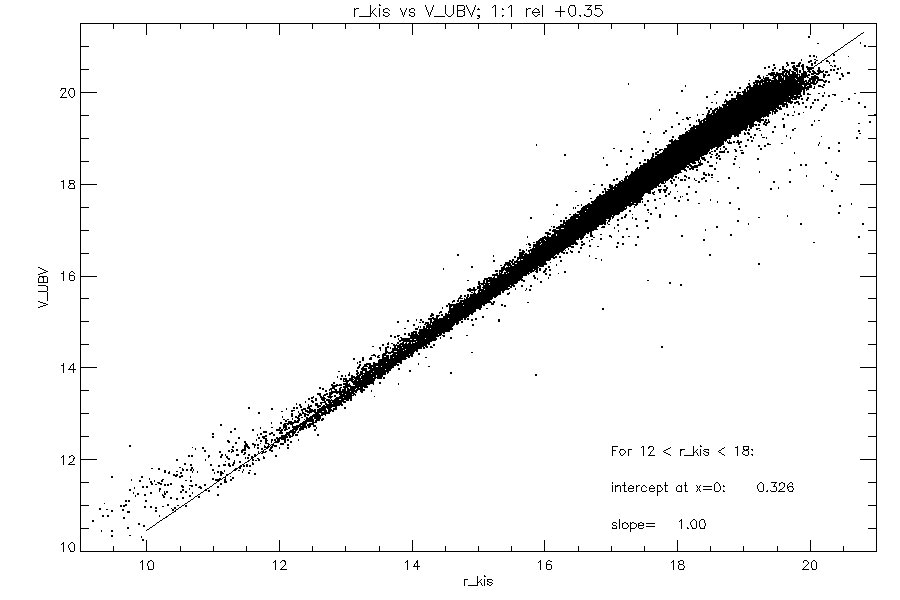
This plot shows another satisfying agreement, on the whole, in both random
and systematic errors. Transposing Jester et al.'s relation, one finds:
Simple Color Plots
a) (g-r)KIC vs. (g-r)KIS Plot
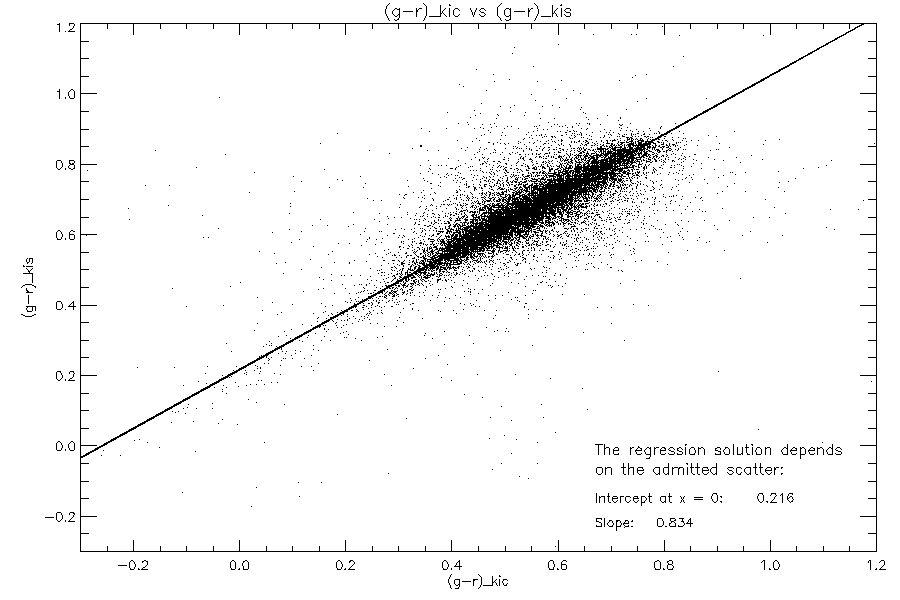
Because of the different magnitude systems adopted by the KIC and KIS, this plot
shows that the intercept in the (g-r)KIC vs. (g-r)KIS
plot is nonzero. Somewhat surprisingly, the slope is 0.83, very different
from 1.0, in the sense that the KIS color shows a smaller range than the
KIC color does. In an earlier preprint of their
paper, Greiss et al. showed a dependence of the magnitude difference,
(gSDSS-gKIC) with color (gKIS -
rSDSS. This is another way of showing the difference in slope
depicted above, and it occurs in the same sense. In this case, the "odd
man out" is the (g - r)KIS color, which suggests
in this case that the nonunitary slope in color comes from the KIS and
not the KIC. MAST will investigate this further when the SDSS/DR8 data
for the Kepler field are ingested.
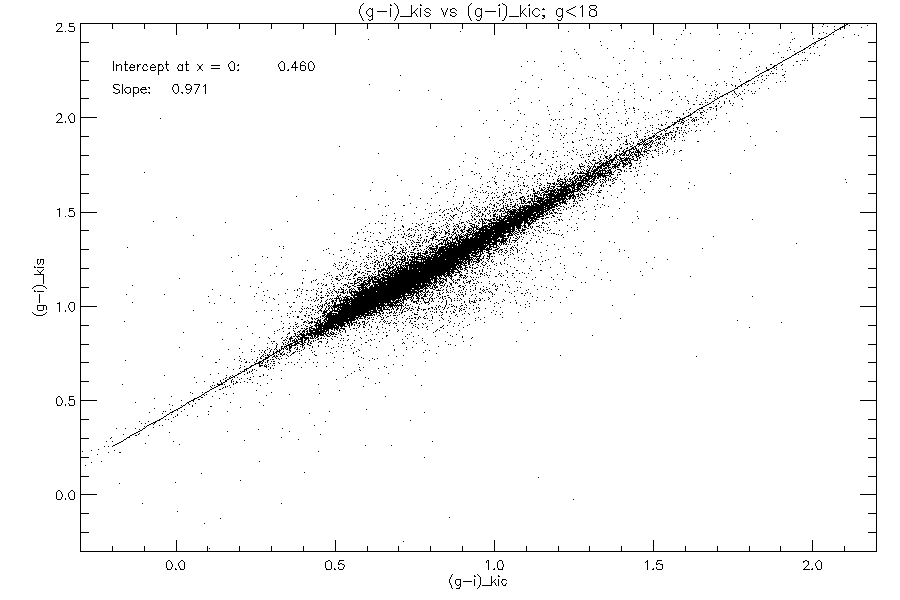
This plot shows a slope that is close to but not quite equal to the
value of 1.0 we would expect based on the individual magnitude plots,
#1 and #3, given above. The nonzero intercept follows from those plots too.
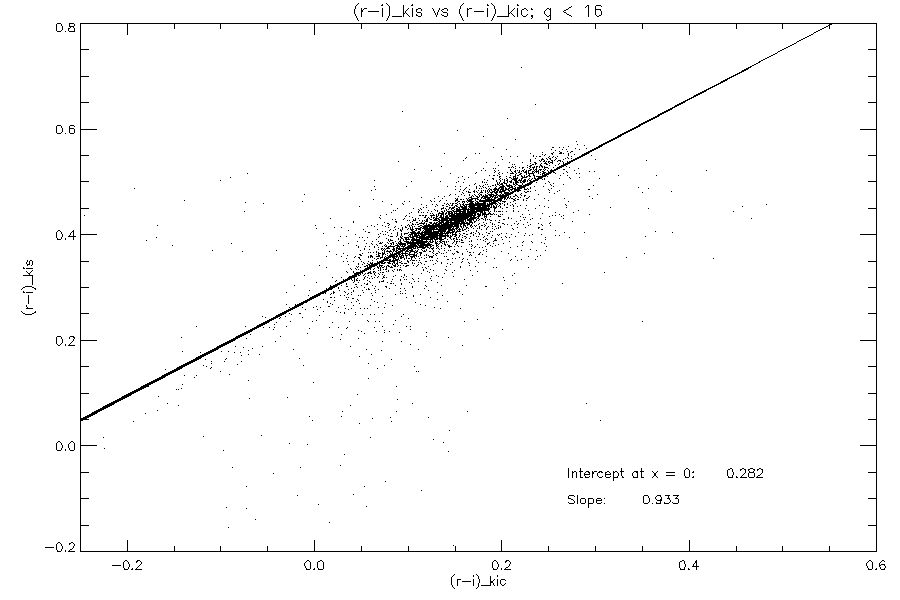
This plot shows a slope that is closer to unitary than the previous
one. The nonzero intercept was discussed in the individual
magnitude plots, #1 and #3 above.
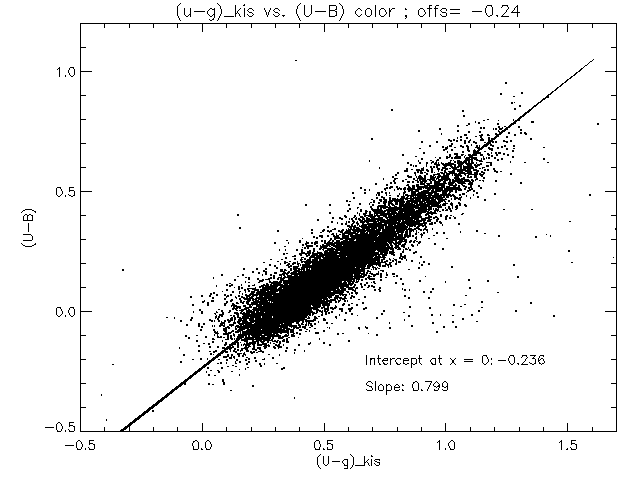
Here we plot the UV-blue color in the KIS and Johnson systems. Although
they exhibit a decidedly nonunitary slope, 0.80, this is to be expected
as this is close to the predicted slope of 0.78 by Jester et al. The offset
of -0.24 is quite different from the one found by Jester et al. because they
considered the (u-g) color based on SDSS's AB system; (U-g)KIS
and (U-B) are both based on the Vega system.
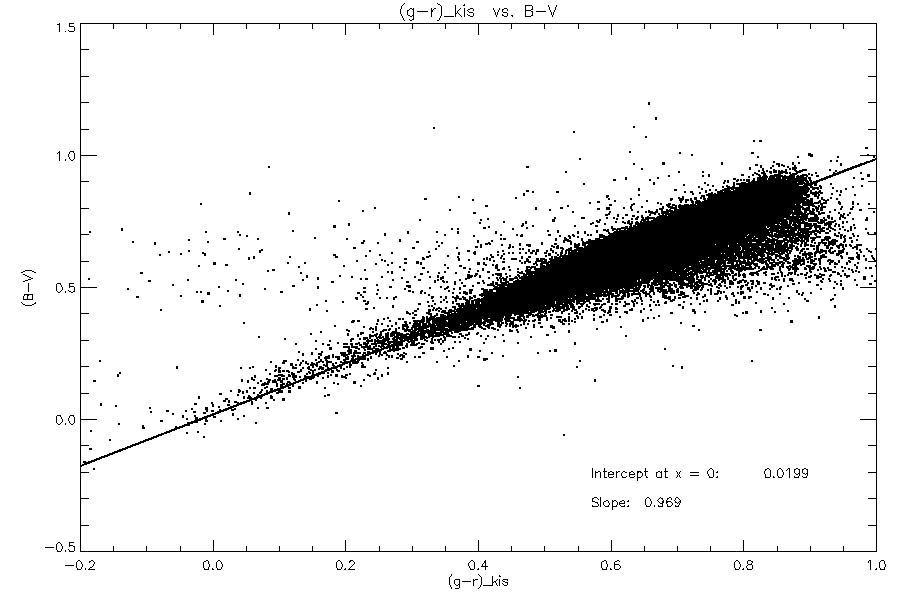
This plot shows almost a perfect regression relation a slope of 0.97
and +0.02 mags. intercept. We notice that the exact solution depends
somewhat on the amount of scatter admitted in the initial solution
(here ±0.2 mags.). For example, mall departures from coefficients
of 1.0 and 0.0 , respectively, can be induced by including or excluding
various amounts of the asymmetric scatter around the mean relation.
Although it is yet to be confirmed from SDSS DR8 data, we
suspect the asymmetric scatter at the red end of the blue is associated
with the unexpected (g-r)KIS dependence in relation to the
(g-r)KIC noted for Plot a).
|
|
|


 Follow Us