


 Follow Us
Elizabeth Stobie (National Optical Astronomy Observatory)
Murray Silverstone (University of Alabama and Eureka Scientific Inc.)
Joseph Rhee (University of California, Los Angeles)
Dean Hines (Space Telescope Science Institute)
NOTE: Although IDL sofware is provided as part of this HLSP, it is done so "as-is". MAST does not support or update this HLSP software to account for changes to IDL, operating system architectures, etc. Users are encouraged to provide updated versions of this HLSP software to MAST or the Astronomy Source Code Library (ASCL) for the benefit of the at-large community.
INTRODUCTION
The NICMOS Legacy Archive PSF Library (LAPL) provides the highest quality, recalibrated, NICMOS coronagraphic science and point spread function (PSF) image data available for archival coronagraphic science investigations requiring PSF template subtraction.
The power of the LAPL is realized not only through the reprocessing of the
raw data into higher fidelity instrumentally calibrated data sets, but
with their quantitative astrometric and photometric calibrations
reported via key metrics (and ancillary data descriptor and quality
information) provided in the FITS headers of the recalibrated
files. The
LAPL recalibrated image files are FITS compliant with any image/data
analysis software that archival researches may choose to use.
The LAPLACE project (HST AR/11279), however, has modified and augmented the
IDL-based IDP3
(Image Display Paradigm 3)
software to enable with ease the exploration and creation of
globally optimized, analysis quality, NICMOS coronagraphic
PSF-subtracted images from LAPL data to facilitate archival researchers
moving very quickly from "search" to "research" modes.
IDP3* is an integrated suite of interactive image data analysis tools for high precision astrometry and photometry, briefly described below. You can also read the IDP3 Help Document (PDF). IDP3 was originally developed by the NICMOS IDT, but has been episodically augmented with both expanded generic, and project/instrument specific, capabilities germane to particular metrical, analytical and interpretive needs. With the development of the LAPL, we have added new capabilities and functionality to IDP3 for high contrast coronagraphic imaging through PSF template subtraction with NICMOS LAPL data. IDP3/LAPLACE version 3.13 goes hand-in-hand with the exploration and analysis of LAPL science and PSF template data retrieved through the MAST/HLA.
A Note on Running IDP3. IDP3/Laplace version 3.1. runs under (and requires) IDL, a cross-platform software system distributed by ITT Visual Information Solutions. IDP3/Laplace 3.13 has been thoroughly tested under IDL Version 7, but not yet under the newly released IDL version 8. We therefore recommend uing IDP3/LPLACE Version 3.13 under IDL Version 7. Seperately, we also provide IDP3/LAPLACE version 3.13 packaged as a "Virtual Machine" (VM), for which no IDL license is required though users will still need to obtain IDL 7.0 from ITTVIS.
- To download IDP3/LAPLACE version 3.13 to run in a licensed IDL environent CLICK HERE (ZIP file).
- To download the IDP3/LAPLACE version 3.13 VM, CLICK HERE (ZIP file).
- For information on obtaining IDL 7.0 from ITTVS, and using the IDP3 VM, CLICK HERE (PDF file).
|
WHAT DOES IDP3 DO?
IDP3 performs stack oriented inter-image arithmetic (in an RPN-like manner on a conceptual data cube of ordered images) on masked or unmasked data providing basic numerical functionality such as image addition, subtraction, multiplication, division, averaging, minimization, inversion, [positive, negative, and absolute] value extraction, and logarithmic conversion to stellar magnitude scales. Clipped or unclipped medians and means of selected images through the image stack may be taken. "Bad" data vetting, rejection, reparation and masking is supported on multiple levels. Application of image attributes such as flux scaling, bias offsets, spatial resembling, position offsetting, field rotation, geometrical rectification and data edge-padding may be separately applied to each image prior to inter-image arithmetic. All operations are interactively controlled in a GUI environment with immediate visualization of results through menu pulldowns and control widgets (windows) or in a scripting-like mode via the execution of an ordered set or operations in IDP3-configured, but ascii editable, "image parameter files". Global image manipulation preferences (for tasks such as sub-pixel interpolation, rebinning and resampling (with, or without, flux conservation), preselection of default display annotations, formatting, overlays, CD matrix deconding, etc.) may be pre-defined for the session environment in a user-tunable "preferences" file, or updated "on the fly" for may operations. The end result of the image stack operations may be dynamically extracted into a sub-array ("region of interest") which may then be operated upon by photometric and astrometric tools such as aperture photometry and extraction with error statistics, cross-section analysis, radial and encircled energy profiling, image centroiding, photocentric moment and 2D Gaussian fitting and model image generation, image noise analysis and others. Resulting images and tabular data derived from the application of the IDP3 integrated analysis tools may be saved for exportation in a variety of data and display formats. A nuts-and-bolts on-line introduction to setting up and using IDP3 may be found HERE. There are both PDF and ".hlp" (text) versions for various topics. A few background references:
|
Back To Top
KEY CAPABILITIES AND USE (A BRIEF INTRODUCTION & GETTING STARTED)
The LAPL provides not only high fidelity recalibrated NICMOS PSF templates and characterizing information, but identically reprocessed (improved) coronagraphic science data images as well. When these science and template images are retrieved (via MAST) from the LAPL, and imported into IDP3, IDP3 will respond to the LAPL added fits header keywords to enable rapid and robust global PSF subtraction and image data analysis. We illustrate some basic conceptual processes below with a walk-through example. For additional information on how to use IDP3's extensive capabilities beyond those we have added in support of NICMOS coronagraphy, consult the application S/W "Help's" which are available from within IDP3 as attached to the GUI menus. Those interactive descriptions can also be found stand-alone as text or PDF files HERE.
A WALK THROUGH EXAMPLE & INTRODUCTION TO IDP3
1. Scenario: We have a science target of interest, HD 34700. We find from searching the LAPL metadata in MAST that HD 34700 had been observed coronagraphically with NICMOS. Specifically, six NICMOS coronagraphic images of HD 34700 in the F110W filter were obtained on 17 Sept 1998 (three each at two different orientation angles). Root file names of those data as archived in MAST are are n4q80 (3 images) and n4q81 (3 images).
2. Search for suitable candidate PSF templates in the MAST/LAPL with: (a) TARGTYPE = POINT_SOURCE), (b) observed at a similar epoch, (c) obtained in the same filter (F110W), with (d) sufficient filter band brightness (F110W_JY) and (e) of similar J-H color indices (keywords: J_2MASS, H_2MASS) compared to the target, and with also: (f) PSFQUAL = 'OK', and (f) TARGCNTR = 'CENTERED'.
In the example below, for illustrative purposes, we will use only 47 of these PSF templates that have been recalibrated with contemporaneous flat fields with all bad pixels repaired ("clc_calf" files). HERE is the list of files for this particular example.
3. For this example you can find (and download) these specific files in THIS ZIPPED DIRECTORY, (~20 MB) or, retrieve these 6 science data images and 47 PSF subtraction template candidates from MAST/LAPL.
4. Start IDP3 and load all 53 images into IDP3 from the IDP3 Main display window's File menu (PDF help file here). Either by:
(a) Menu item: Load Images/Load Image (note: "shift clicking" in the file requester load GUI will allow you to select multiple files).
(b) or, build a list (ascii file) of file names to load (e.g., in a unix window: ls n*clc_calf.fits > MYFILES.txt {or a file name of your choosing, of course}) and then use Menu item: Load Images/Load List. Note you can use the "MYFILES.txt" that is included in the sample download directory along with with the 53 FITS files.
Helpful Hint: In general, For (b), edit MYFILES.txt to list the names of the 6 HD 34700 files (n4q80 and n4q81) first in the file, this just for convenience so they are easy to find in the stack of images loaded, as if named first they will be on the top of the stack. This was already done in the sample file.
Note, when loading files from a list of files (e.g., MYFILES.txt), the list of files wmust be in the same directory as the FITS files to be loaded, OR you will need to put the path names to where the named files reside in your MYFILES.txt listing.
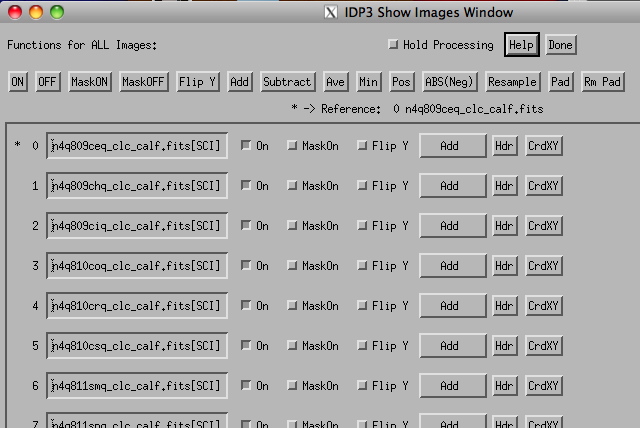
6. IDP3 uses a concept of a "reference image". When you (later) are aligning, scaling, or doing other functions that are referenced to a particular image in the stack you must tell IDP3 which image is the reference image. At any time can see which one is currently the reference image by looking for a "*" to the left of its name (and load order number) in the Show Images widget. When you initially load a stack of images, by default, the first one in the list is the reference image. If you wish to change the reference image, at any time, click on the name of the file in the show images widget that you want to be the reference image. In this example keep (or make) the first image (number 0, file name: n4q809ceq_clc_calf.fits) the reference image.
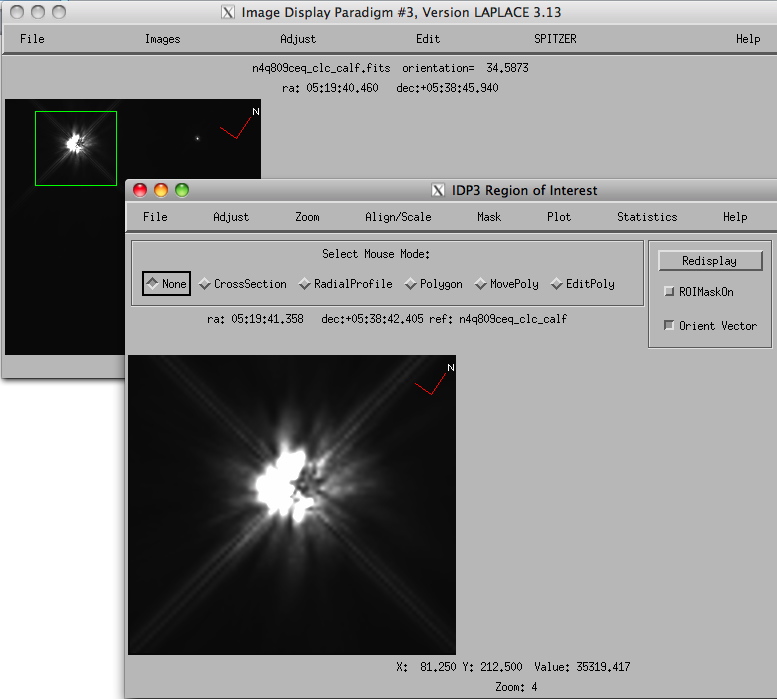
7. In the IDP3 main display, click and with the cursor drag out a box around the target position (upper left quad of the image) to define a "region of interest". A "Region of Interest" (ROI) widget (text version of help file here) will pop up with this "sub-array" region displayed (below but shown "zoomed" by 4x, see step 8; along with menus and buttons to access its functions).
8. Optional: Just so you can see it better... In the Region of Interest (ROI) widget, select 4 (x) from the Zoom menu.
9. PRECISE ASTROMETRIC ALIGNMENT OF ALL IMAGES. The fits headers of the LAPL files carry in them the location of the coronagraphically obscured target as had been determined from image centroiding of the (preceding) target acquisition image and applying the spacecraft repositioning slew executed to place the target at the "sweet spot" of the coronagraph. To automatically co-align all of the images to the reference image, in the Region of Interest window, in the Align/Scale menu, select "Align by Centroids" (make sure you pick the right alignment option). All of the images will be co-aligned to the reference image. (It's very fast - you may not see it happening...).
Note of detail: Only the images that are "turned on" in the Show Images window will be co-aligned. In this example they should all be turned on, but if you turned any off, they will not be co-aligned.
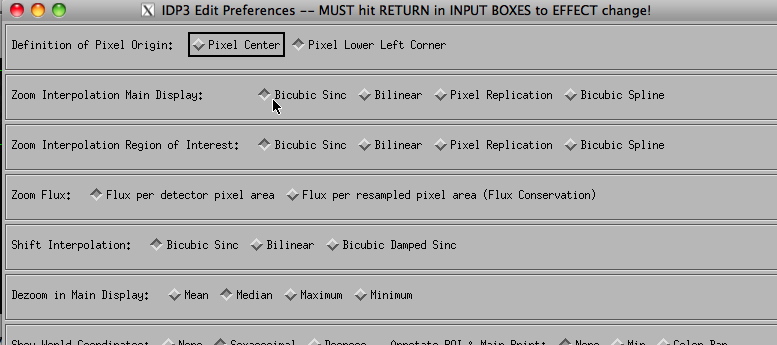
Under the hood: Each image is resampled onto a same-size pixel grid using a 2D interpolation method which is user selectable (default by a user "preference" file, or can be changed on-the-fly by selecting "Edit Preferences" from the File menu in the main IDP3 menu (see below). By default the resamping (interpolation) method is bicubic with apodization by a since function (to suppress ringing and overshoot in undersampled (Nyquist < 2) data.
10. FLUX DENSITY RENORMALIZATION OF THE TEMPLATES. The fits headers of the LAPL files carry in them an estimate of the filter band flux density of the target. To automatically rescale the brightness of the PSF templates to that of the reference image Region of Interest window, in the Align/Scale menu, select "Auto Flux Scale".
Under the hood: We (the LAPLACE project) have estimated the filterband flux densities of all targets based upon their 2MASS J, H, and Ks catalog magnitudes transformed into the NICMOS F110W filter band using the synphot synthetic photometry package and NICMOS instrument model. For each target we use a model or template spectrum to do the filter band transformations. (In a few cases for objects not in the 2MASS catalog we use published JHKs phototmetry from the literature. In rare cases JHKs photometry does not exist, and in those cases the images caanot be auto flux scaleed). The FITS header keyword CPHOTSTR documents (in synphot input syntax) the assumptions we made about the stellar photospheric SEDs in doing the band transformations. The FITS header keyword F####_JY documents the derived flux density in Jy for the NICMOS filterband (F####, e.g., F110W). N.B., in additions to uncertainties in photometric transformations, some sources may be intrinsically variable whereas published JHKs catalog magnitudes were used and may differ at the epoch of the observation. This, in some cases, can lead to PSF flux density renormalization over or under estimates in PSF templates.
Ready to see some results? Try the first science data image: n4q810c0q_clc.calf.fits as we detail in the rest of this introductory walk-through.
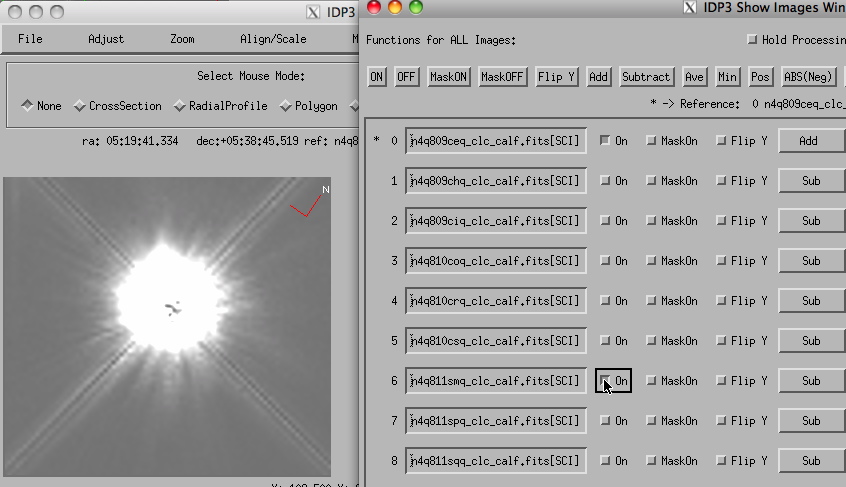
11. In the Show Images widget (text version of help file here):
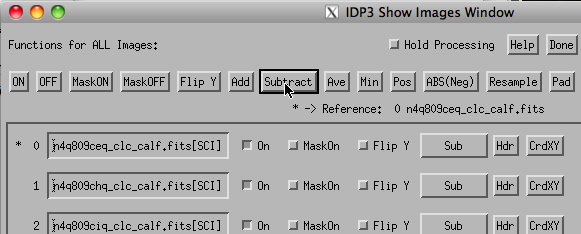
(a) Look for the row of buttons below "Functions for All Images:" and select the button that says "Subtract". This will set all images to be Subtracted from the images "above" in the stack. This will change the target image from Add to Subtract (along with the rest, but next you will change that back again in step 11b). |
 |
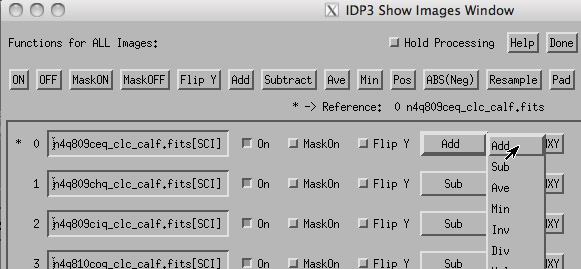
| (b) In this example we are treating the first image in the
Show Images window as the target image (it also
is the reference image, but it does not have to be). Next to the
image file name on the first row to the right of three buttons you will
see a pulldown contextual menu block set to Sub (subtract). All the images should say Sub after step 11a. Click on the Sub button on the first row (target image) and you will see a list of mathematical functions to apply to that image. Select Add. |
 |
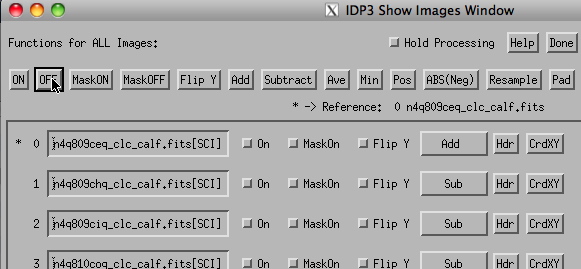
(c) On the row of "Functions for All Images" buttons, click the OFF button. All the images will be turned Off (note the state of the "On" buttons next to the file names change. The MAIN IDP3 window will be blank (black, all zero). The Region of Interest window, however will not be clear (it will "remember" what was last done, until you turn one or more images back on again). |
 |
|
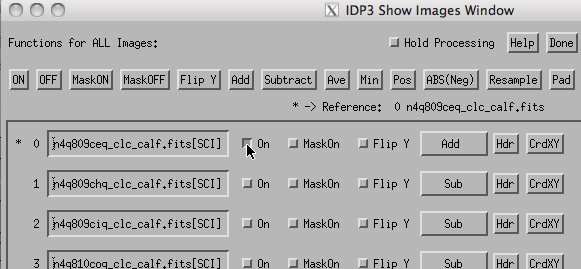
(d) Turn on
JUST the first image -- click the On button next to the file name for
image number 0.
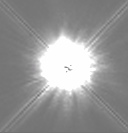
You will now see the coronagraphic image of just HD 34700 in the main AND region of interest (ROI) windows. (If you don't like the size of the ROI box, draw out a different one in the main window and the ROI will auto refresh). |
 |
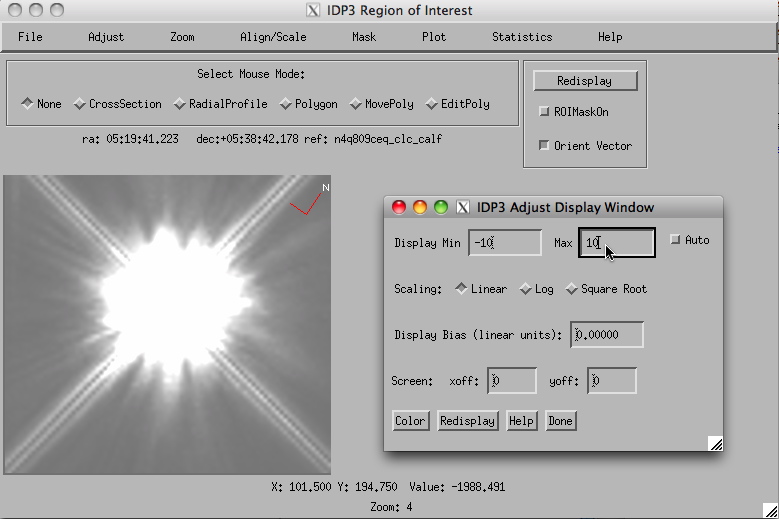
Note: The image displays by default are auto-stretched at +/-3 sigma. If you don't like the autostretch In the main IPD3 window from the Adjust menu select Adjust Display (PDF help file here) (there is a separate Adjust Display in the ROI window, to allow you to adjust the display range two windows differently). A display widget will pop up that will allow you to manually set the display range (counts per sec per pixel in these files), scaling type (Stretch) and other options.
NOTE: In any of the IDP3 widget editable numeric fields, after you enter a number you need to hit the (RETURN) key with the edit cursor in the box to have it take effect. You can leave most widets up for handy access after you make any input changes, or click the Done button to dismiss them when you are finished.
12. In the Adjust Display Window change the Display range from -10 (min) to 10 (max). At this stretch you can now see the HST diffraction spikes.
As we discuss this specific example, recall that the first 6 images (numbers 0 - 5) are all images of HD 34700, the rest are PSF templates.
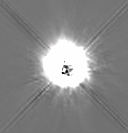
13. In the Show Images widget, the first listed PSF template is image number 6 (n4q811smq). That image (like all others) is set to be subtracted -- but it is turned off. Turn it on (click the On button to the right of its file name).
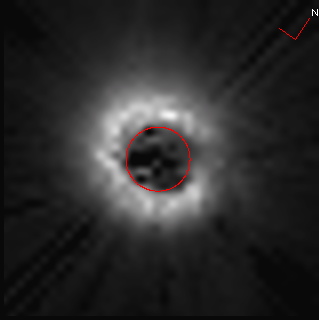
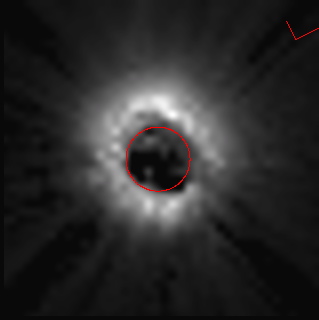
Congratulations - You have "discovered" the HD 34700 circumstellar disk (Schneider et al. 2011 in prep)! We do say "congratulations" as this was one of the yet unpublished treasures lurking in the MAST.
Is it real? Try some other PSF templates.
14. Turn OFF this image (#6 in the stack) and turn on #7. (You must turn off #6 or, with both of them turned on, you will be subtracting BOTH PSF templates from the target image).
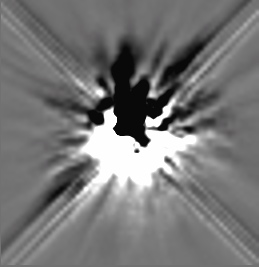
Template #6 and #7, when separately subtracted produce nearly identical images, but those are both of the same star taken "back to back" in the same orbit, so you should expect close similarity. Go through the stack sequentially turning off and then on other templates using different stars at other times (just a few resulting PSF template subtracted images, the next eight stack-loaded difference images, are shown below). This will give you some sense of the diversity in the PSF subtractions. This is a SOLID detection, and the diversity (variance in image differences) with a PSF template ensamble provide a good estimate of the systematic uncertainties in the PSF subtractions.
 0-7 |
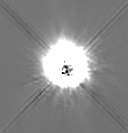 0-9 |
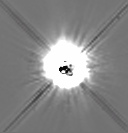 0-11 |
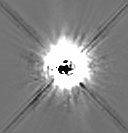 0-13 |
 0-8 |
 0-10 |
 0-12 |
 0-14 |
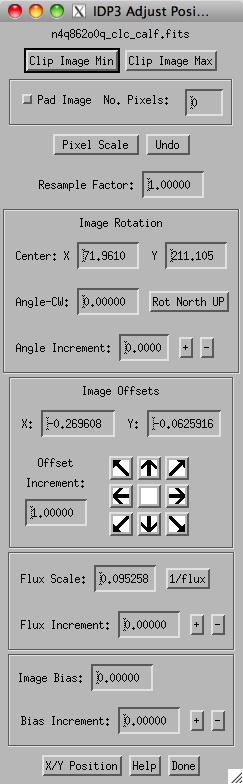
15. If you are following this example with sample data files suggested in the MYFILES.txt listing, continue through the rest of the templates. We have included a few "erroneous" templates to illustrate a few things that can go wrong. #'s 33 and 34 (n4q862o0 and n4q862o0) were actually decentered w.r.t. the "sweet spot" of the coronagraph (in opposite directions). Note in the FITS headers of these files we had set TARGCNTR='DECENTERED', but we included these images (below) for illustration.
 |
 |
The PSF template decentering cannot be corrected by "shifting" the template image since the decentering of the template star in the coronagraph iyself changed the structure of its PSF. We digress to illustrate this (and so you can try this), with some additional IDP3 functionality by introducing the "Adjust Position" widget.
Back To Top
DIGRESSION: The Adjust Position Widget (text version of help file here)
| Make image 33 (n4q862o0, the first
decentered PSF template) the reference image by clicking on its name in
the Show Images widget. Make sure it (and no other template) is
turned
on and set to Subtract, and image #0 (of HD37400) is also turned on
(and set to Add). From the main IDP3 window's Adjust menu select
Position. An adjustment widget (show at the right, resembling a
TV remote control) will pop up and allow you to alter the "adjustable"
attributes of he reference image. The center section labeled Image Offsets indicates how this image has been offset in X and Y from the image to which it was originally aligned (i.e., the #0 image of HD 34700 by way of the ROI's "Align by Centroids". You can change that offset for this image either by entering in alternate offsets (and hitting [RETURN]), or incrementally by setting the Offset increment (in pixels, or subpixels; e.g. 0.01) and using the arrow buttons to move the template image around. By doing so you will see that a "decentered" template in the coronagraph cannot be used for a centered target. The "Flux Scale" entry indicates how the template flux density was "Auto Scaled" to match that of the target. This to can be adjusted - in the case of a PSF over or under subtraction (e.g. due to stellar variability) either by entering in a new scale factor, or incrementally by setting the flux increment and hitting the [+] or [-] buttons. Other adjustments that can be made (including links to other widget functionalities) are explained by hitting the HELP button or at the instructional web site linked earlier on this page. (It is through this widget that you can also rotate images, add or subtract zero-level biases, resample by arbitrary pixel fractions, and map (with independent geometric X/Y rectification) to other pixel scales. Note that as you make these and other changes the effect of those changes instantly is reflected in the main and ROI image display windows. Also note that the name of the currently selected reference image is shown at the top of the widget. Changing the reference image by clicking on the name of another image in the Show Images list will alter which image the Adjust Position is reporting on and controlling. It would be instructional to turn off his "bad" template, turn on a "good" one, make it the reference image and make small incremental adjustments to et an idea of the efficacy of the LAPL/IDP3 auto alignment and scaling functions and FITS header data. |
 |
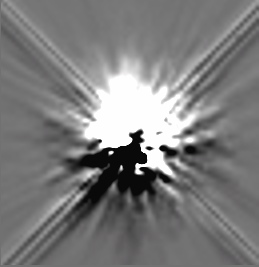
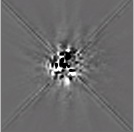
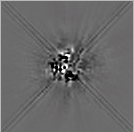
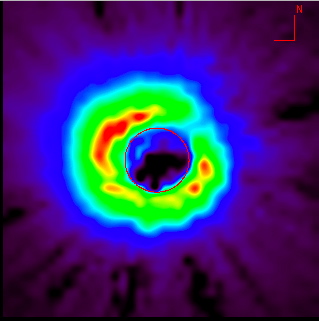
| The existence of circumstellar
structure (not an artifact arising from inefficacous PSF
subtraction) is proven by an ensemble of PSF template minus PSF
template "null subtractions" showing no sign of circumstellar
brightening using the same templates, flux density renormaizations and
astrometric alignments applied in the suite of target minus PSF
template image. (All images shown strected identically as images above). |
Representative PSF template –
template subtractions (same stretch as above)
|


COMBINING INDIVIDUAL PSF SUBTRACTIONS:
IDP3 provides functionality for multiple image combinations, in many forms. The on-line user's guide and program HELP files should be consulted for details. Here we illustrate immediately obtainable results using the LAPL parameterized global PSF subtractions ilustrated and spoken to above.
 |
 |
 |
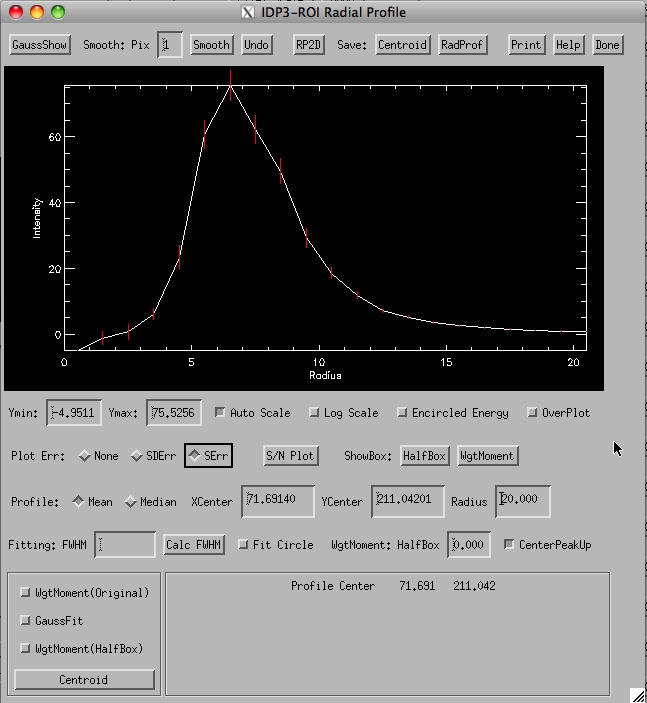
Numerous IDP3 quantitative image analysis tools, e.g., for surface or aperture photometry (text version of help file here), radial profiling (text version of help file here), object centroiding, photometric cross-sections (text version of help file here) etc., are available for immediate metrical analysis of the LAPL derived PSF subtracted images. E.g., below an azimuthally averaged radial surface brightness profile with error estimation of the HD 37400 circumstellar structure is shown using IDP3's radial profile capability. An identical analytical profile computed from a similar PSF template minus template suite standard deviation image (produced with the IDP3 image combination tool) provides direct estimation of the remaining systematic uncertainties from PSF subtraction.
This introductory IDP3/LAPLACE "readme" page only scratches the surface of the capabilities encoded in he IDP3 image data analysis S/W as augmented and "tuned" for ingestion and metrical analysis of NICMOS coronagraphic data processed through the LAPL.
As said before, "good hunting!"
Go to: The NICMOS Legacy Archive PSF Library Page
The creation of the Legacy Archive PSF Library for NICMOS coronagraphy, and the symbiotic augmenting functionality of IDP3/LAPLACE v3.1.3 is based on observations made with the NASA/ESA Hubble Space Telescope, obtained from the Data Archive at the Space Telescope Science Institute, which is operated by the Association of Universities for Research in Astronomy, Inc., under NASA contract NAS 5-26555. These observations are associated with programs 7038, 7052, 7157, 7179, 7220, 7221, 7226, 7227, 7233, 7248,7329, 7418, 7441, 7808, 7828, 7829, 7834, 7835, 7857, 7897, 7924, 8079, 8979, 8983, 8984, 9693, 9768, 9834, 9845, 10147, 10167, 10176, 10177, 10228, 10244, 10448, 10464, 10519, 10527, 10540, 10560, 10599, 10847, 10849, and 10852. Support for program AR 11279 (under which this work was undertaken) was provided by NASA through a grant from the Space Telescope Science Institute, which is operated by the Association of Universities for Research in Astronomy, Inc., under NASA contract NAS 5-26555.”
Back To Top
|
|
|