


 Follow Us
| GCAT Home |
Catalog Creation |
Kepler GCAT Differences |
Data Access and Products |
SQL CasJobs Access and Examples |
Kepler GCAT - A GALEX Source Catalog in the Kepler Field
The Kepler GCAT is very similar to the GASC and GMSC catalogs, and was essentially processed with the same software and analysis steps. There are some important differences between the Kepler GCAT and the GASC/GMSC, which we now summarize.
- Kepler GCAT uses tiles observed through GR7 (GASC/GMSC only through GR6). The GASC and GMSC catalogs use tiles up through the GR6 data release. The Kepler GCAT includes tiles observed through GR7, therefore, while there is some overlap between the GASC/GMSC catalogs, many users will want to use the Kepler GCAT for targets in the Kepler field. A complete list of GALEX tiles used in creating the Kepler GCAT is available.
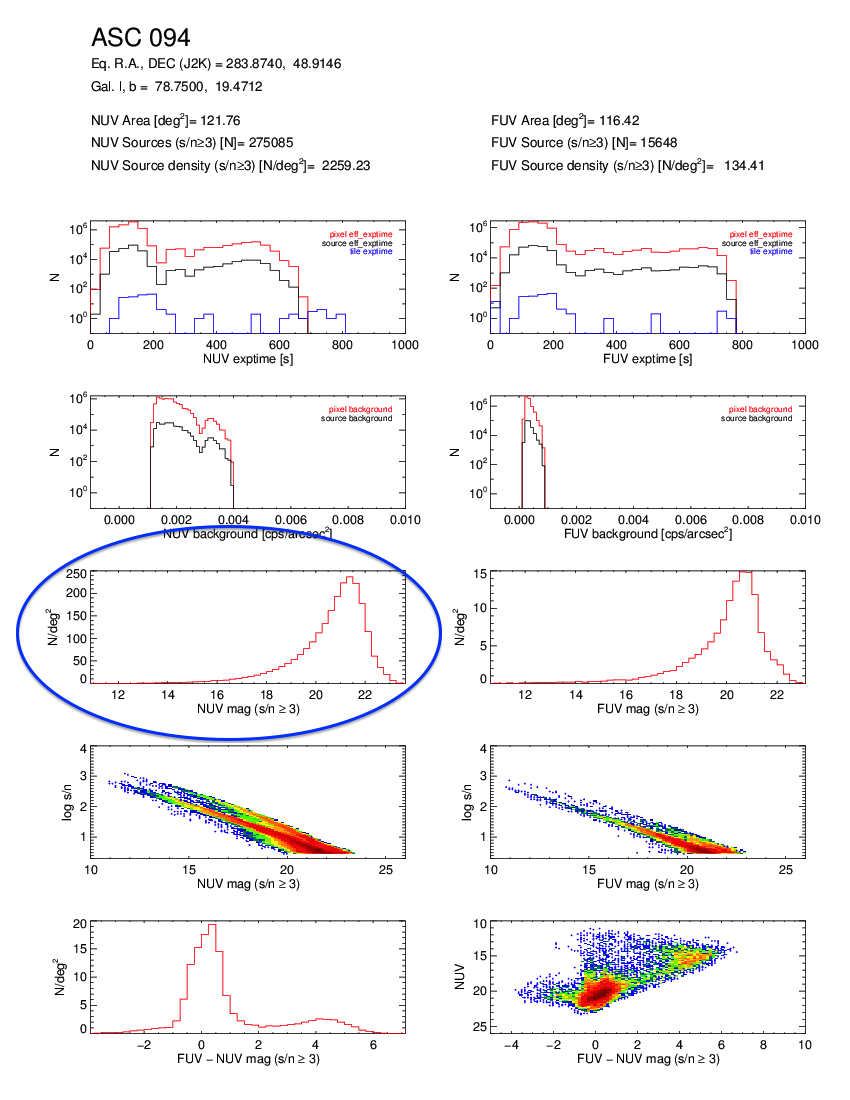
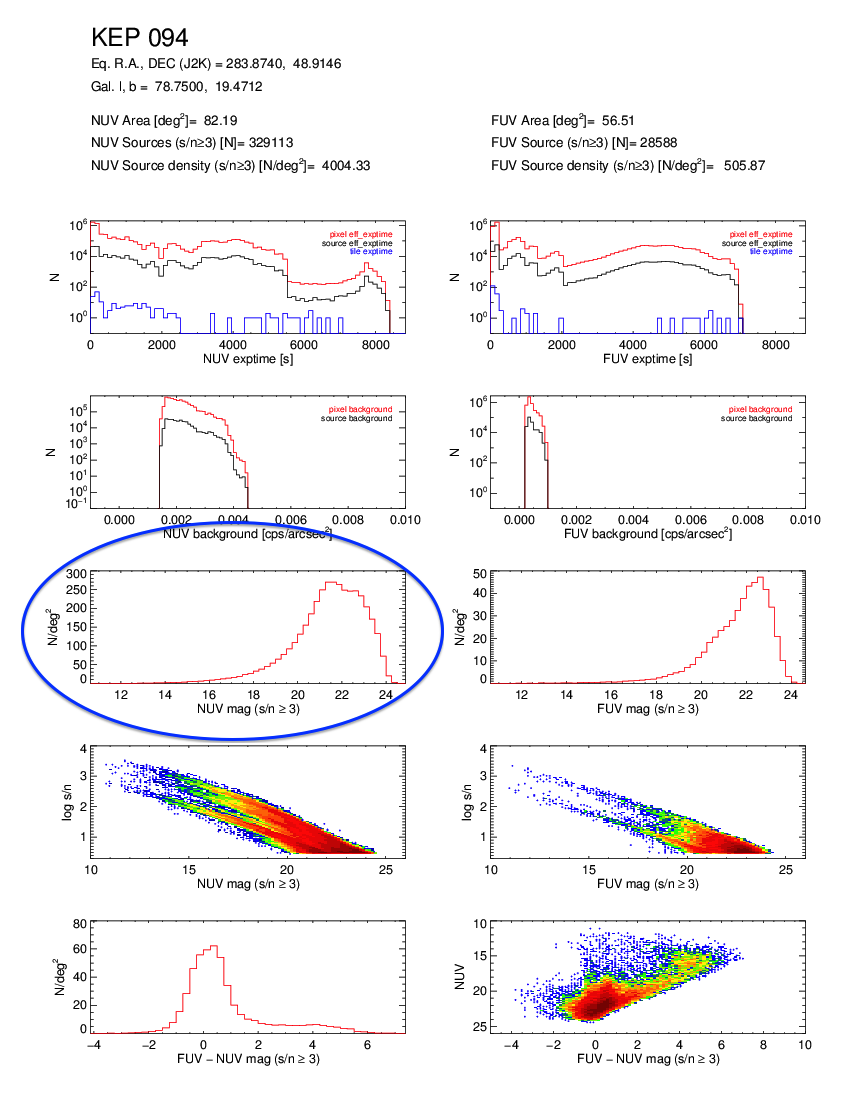
- Kepler GCAT uses tiles from AIS, MIS, and DIS in one catalog (GASC = AIS, GMSC = MIS). Because the Kepler GCAT uses tiles with a broad range of integration times, the completeness limit varies quite a bit within the Kepler field. This is readily apparent if one plots the number of NUV or FUV sources vs. NUV or FUV apparent magnitude. There are sharp cutoffs at NUV = 21 and 23 magnitudes for the GASC and GMSC samples, respectively, whereas the Kepler GCAT distribution has a much less well-defined drop-off(see the example figures below). Extreme care must be taken when determine limiting magnitudes and completeness within the Kepler GCAT.
- Kepler GCAT includes one tile with exposure time > 10,000 seconds. In the interest of completeness, we decided to include all visit tiles in the Kepler field, rather than making the requirement that any visit have < 10,000 seconds of integration as was done for the GASC and GMSC catalogs. This resulted in one visit tile being included that would not have otherwise if following the same criteria applied to the GASC/GMSC. Users should take note of this fact.

|

|
|
Figure 7: The NUV coverage fraction of the data for chunk 089 in the Kepler GCAT. Click for full resolution image.
|
Figure 8: The NUV coverage fraction of the data for chunk 091 in the Kepler GCAT. Click for full resolution image.
|
|
|
|
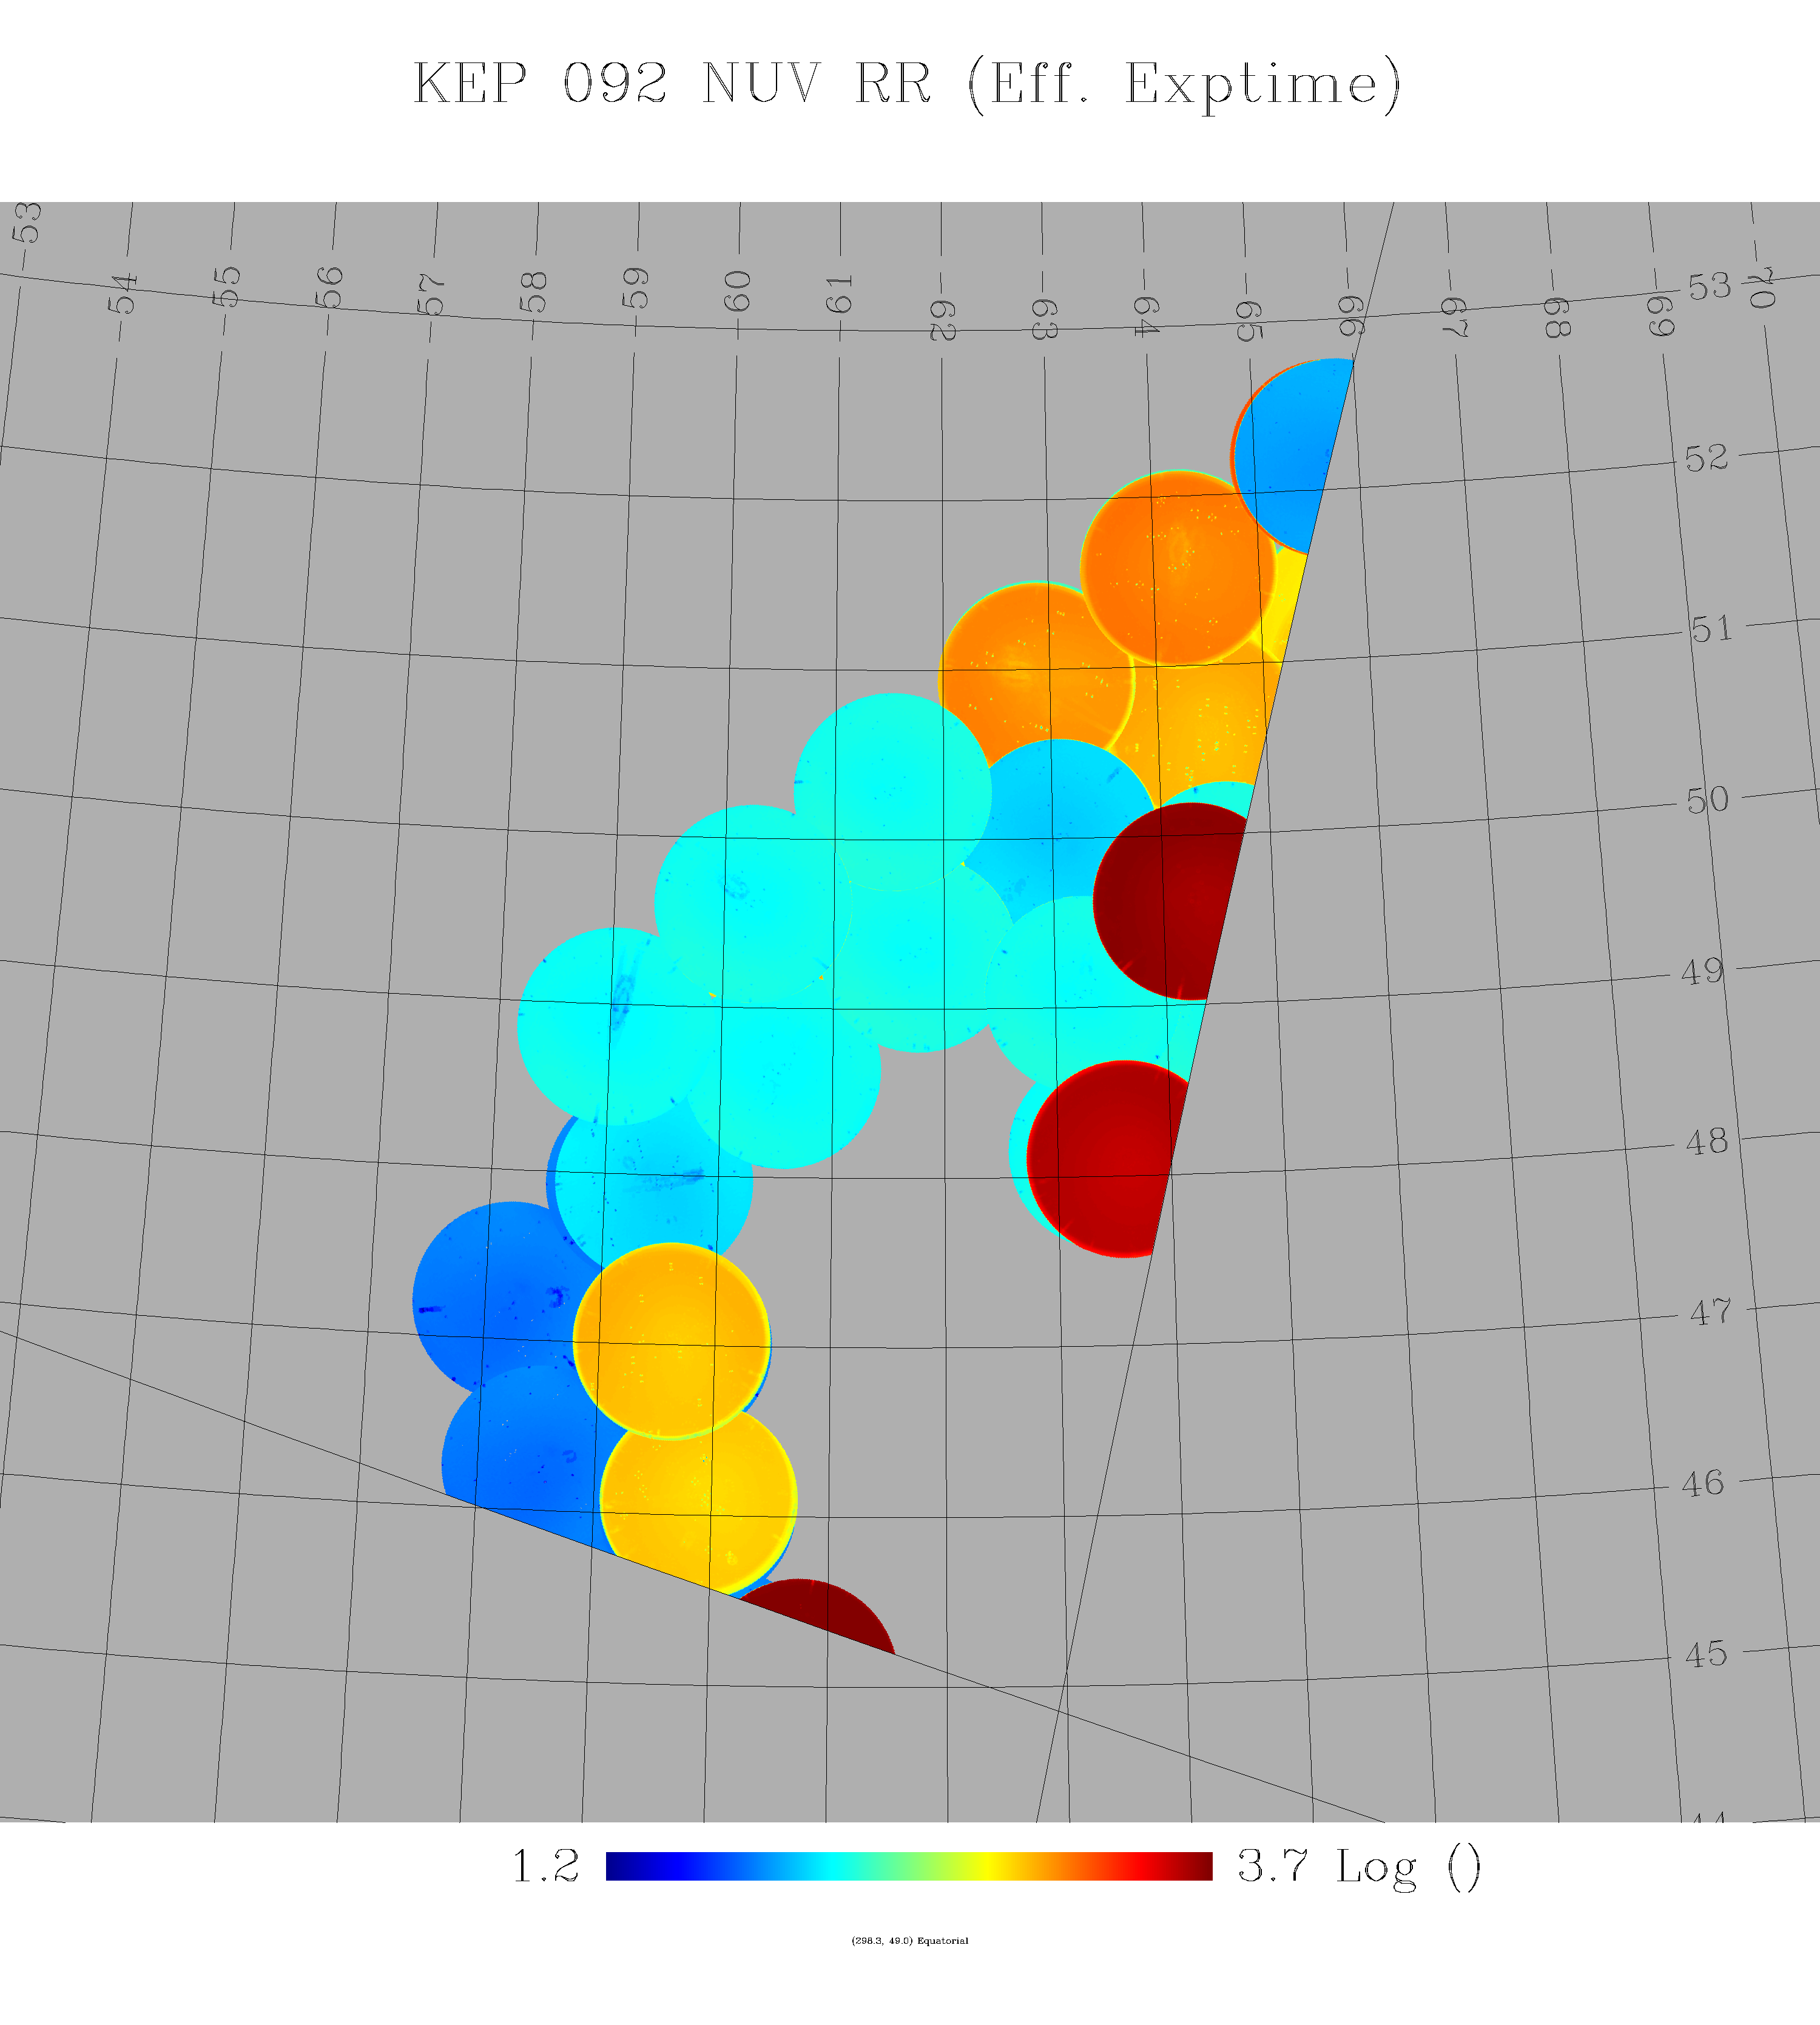
Figure 9: The NUV coverage fraction of the data for chunk 092 in the Kepler GCAT. Click for full resolution image.
|
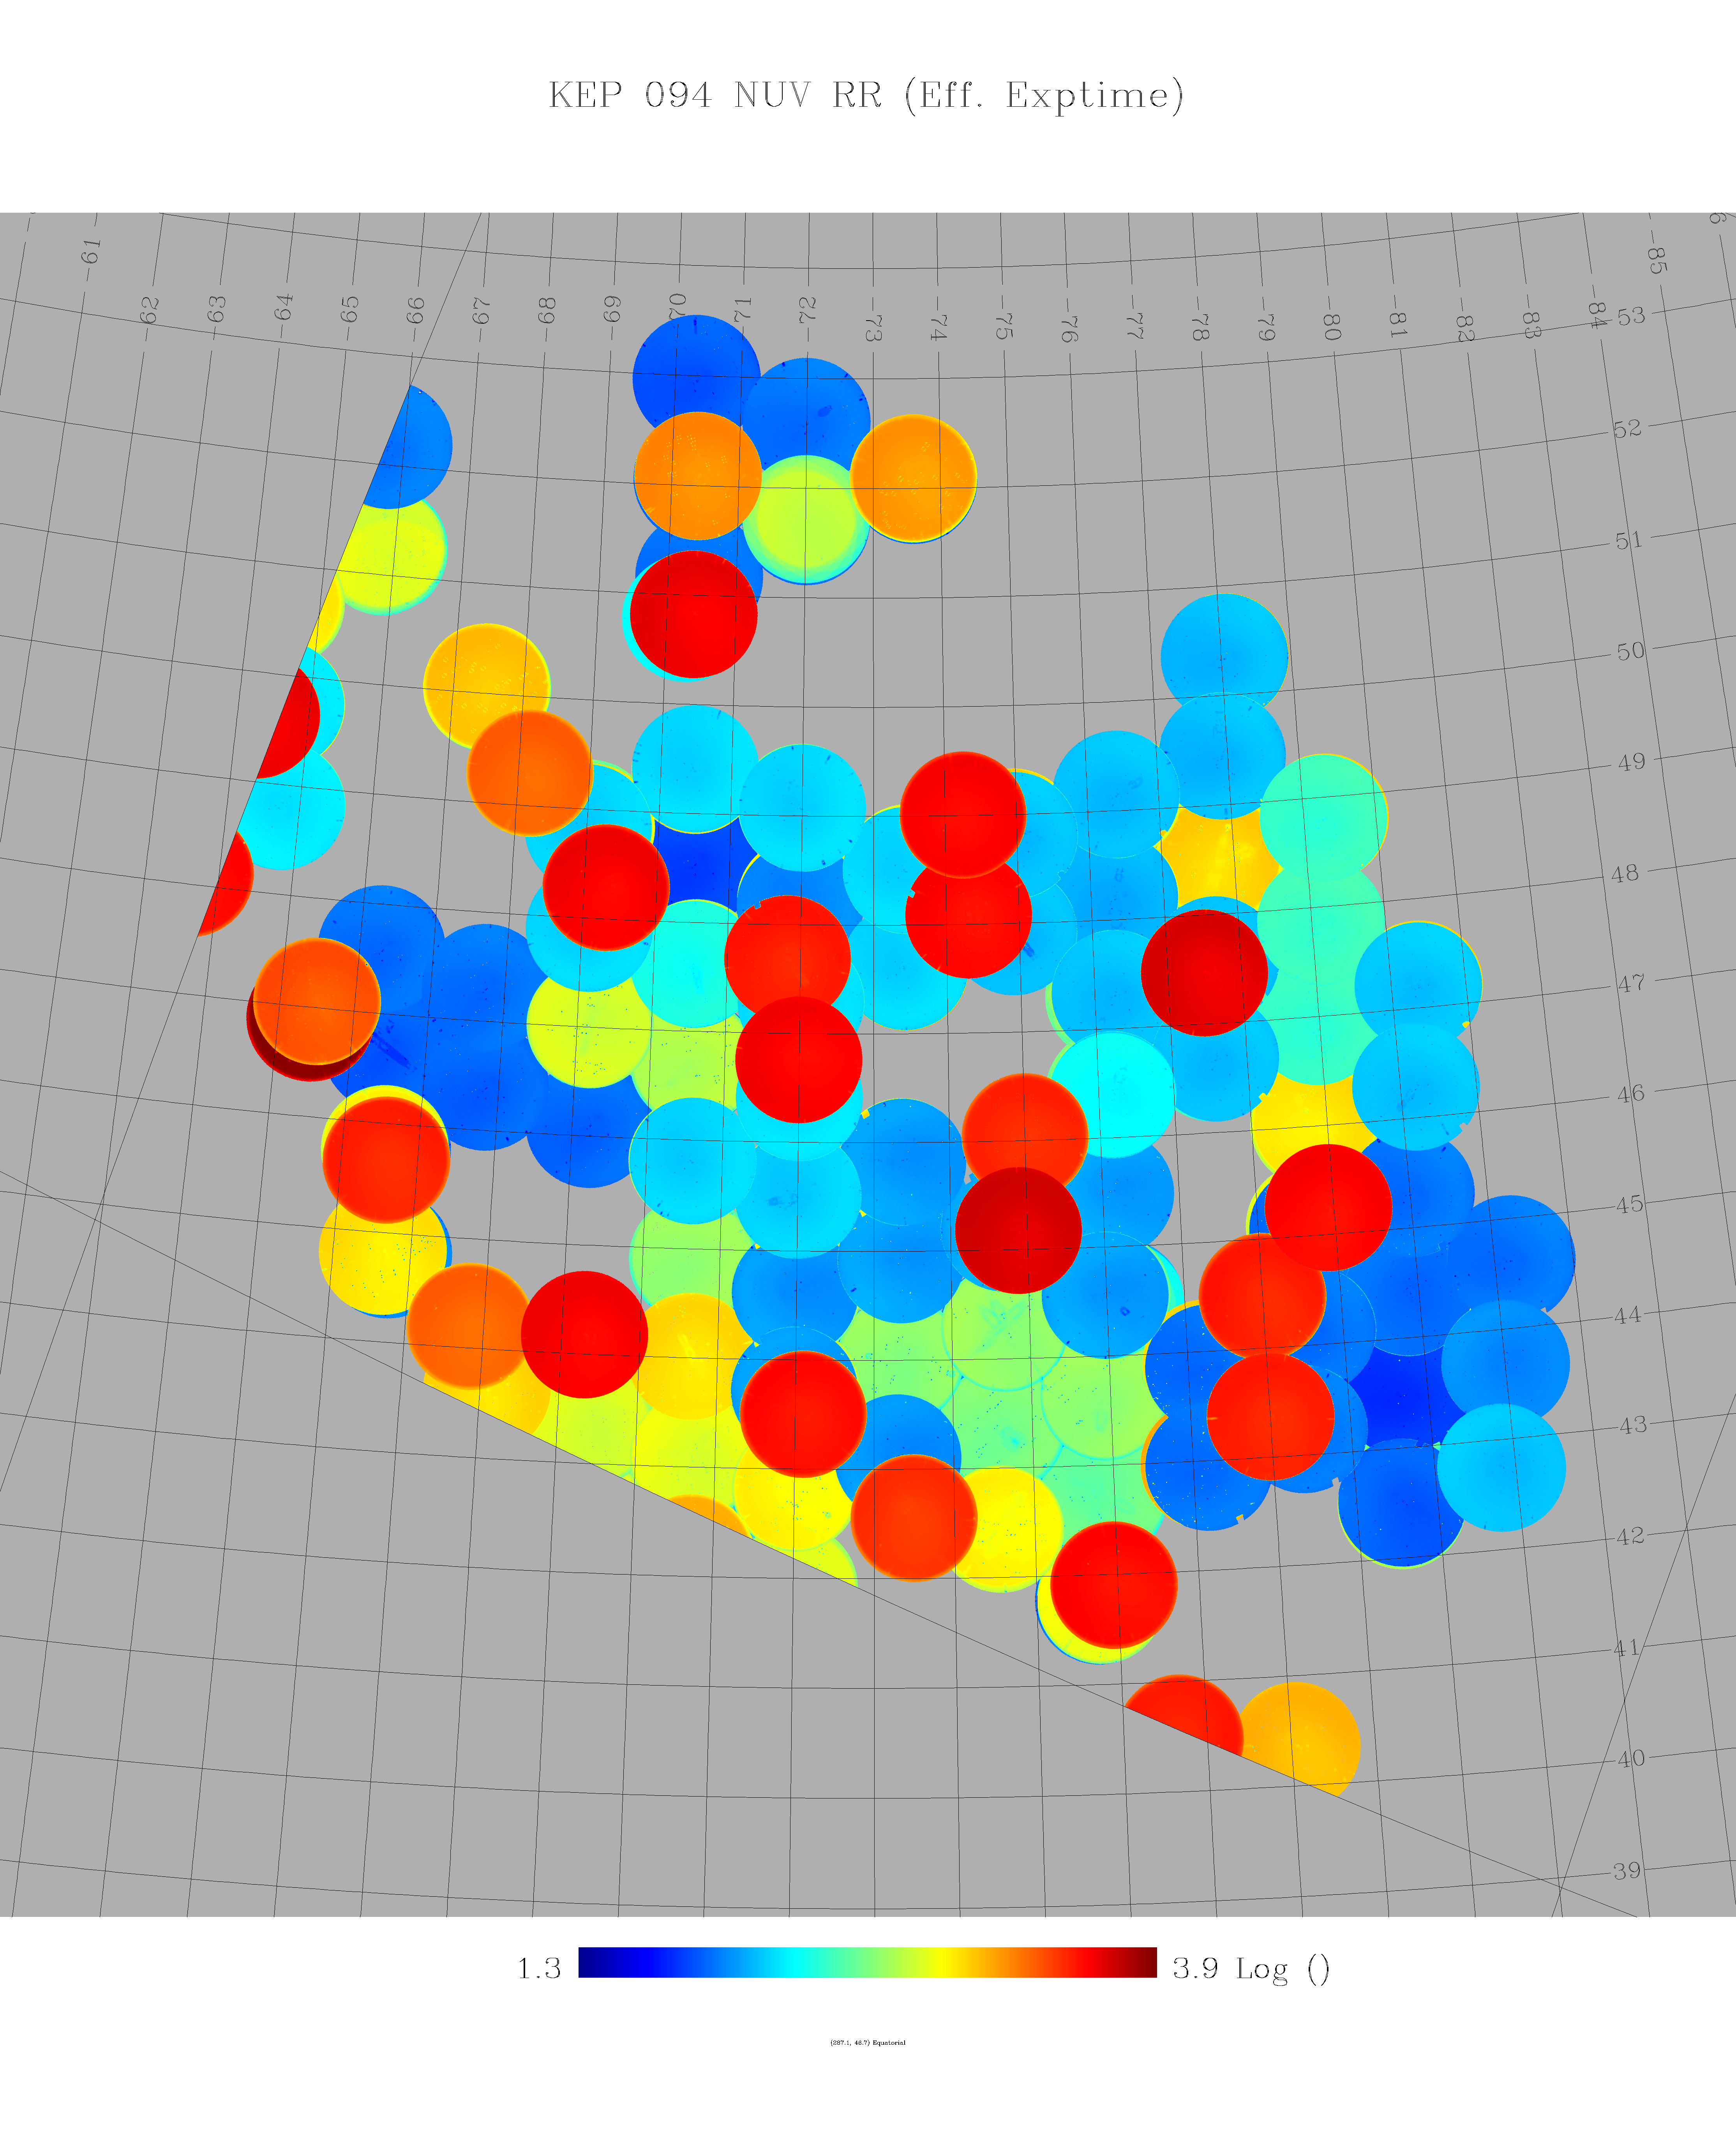
Figure 10: The NUV coverage fraction of the data for chunk 094 in the Kepler GCAT. Click for full resolution image.
|
|

|
|
|
Figure 11: Distribution of GASC NUV sources within Kepler GCAT Chunk 94.
|
Figure 12: Distribution of GMSC NUV sources within Kepler GCAT Chunk 94.
|
Figure 13: Distribution of Kepler GCAT NUV sources within Kepler GCAT Chunk 94.
|
Back To Top
|
|
|