


 Follow Us
| GCAT Home |
Catalog Creation |
Kepler GCAT Differences |
Data Access and Products |
SQL CasJobs Access and Examples |
GASC and GMSC - GALEX All-Sky-Survey and Medium-Sky-Survey Catalogs
Sky Coverage
Below is a summary of the sky coverage and approximate depth of the GASC and GMSC. These are based upon the NUV exposure time. Please note that the exposure time and background varies quite significantly within each survey, resulting in a corresponding variation in the limiting magnitude.
| GASC and GMSC Sky Coverage | |||
| Exposure Time | Sky Coverage | Depth | |
| Survey | (seconds) | (deg2) | (mAB) |
| GASC | ~100 (up to 800) | 27,000 | 20.5 |
| GMSC | 1,000-10,000 | 5,000 | 23.5 |
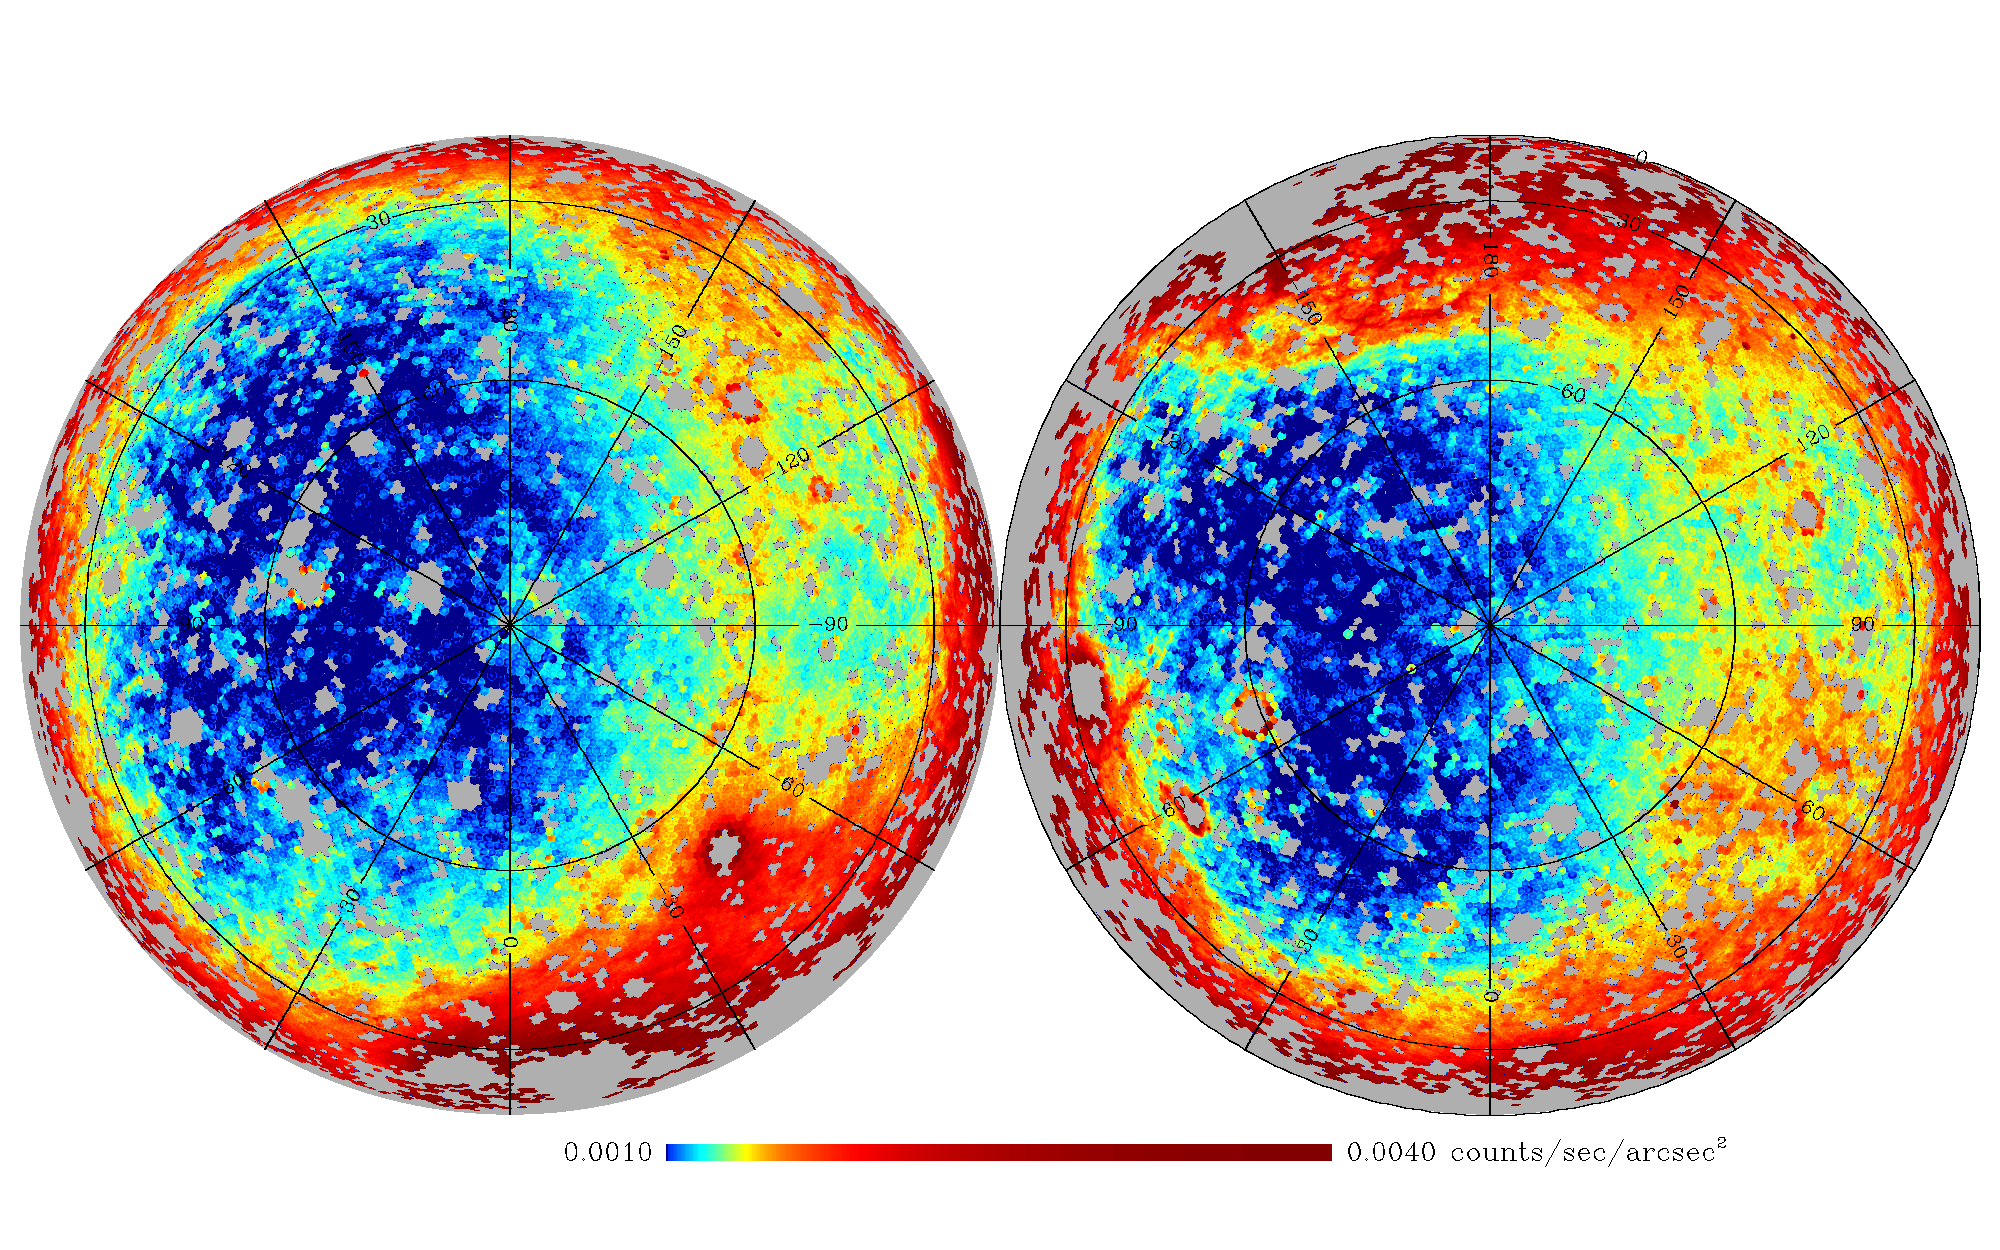
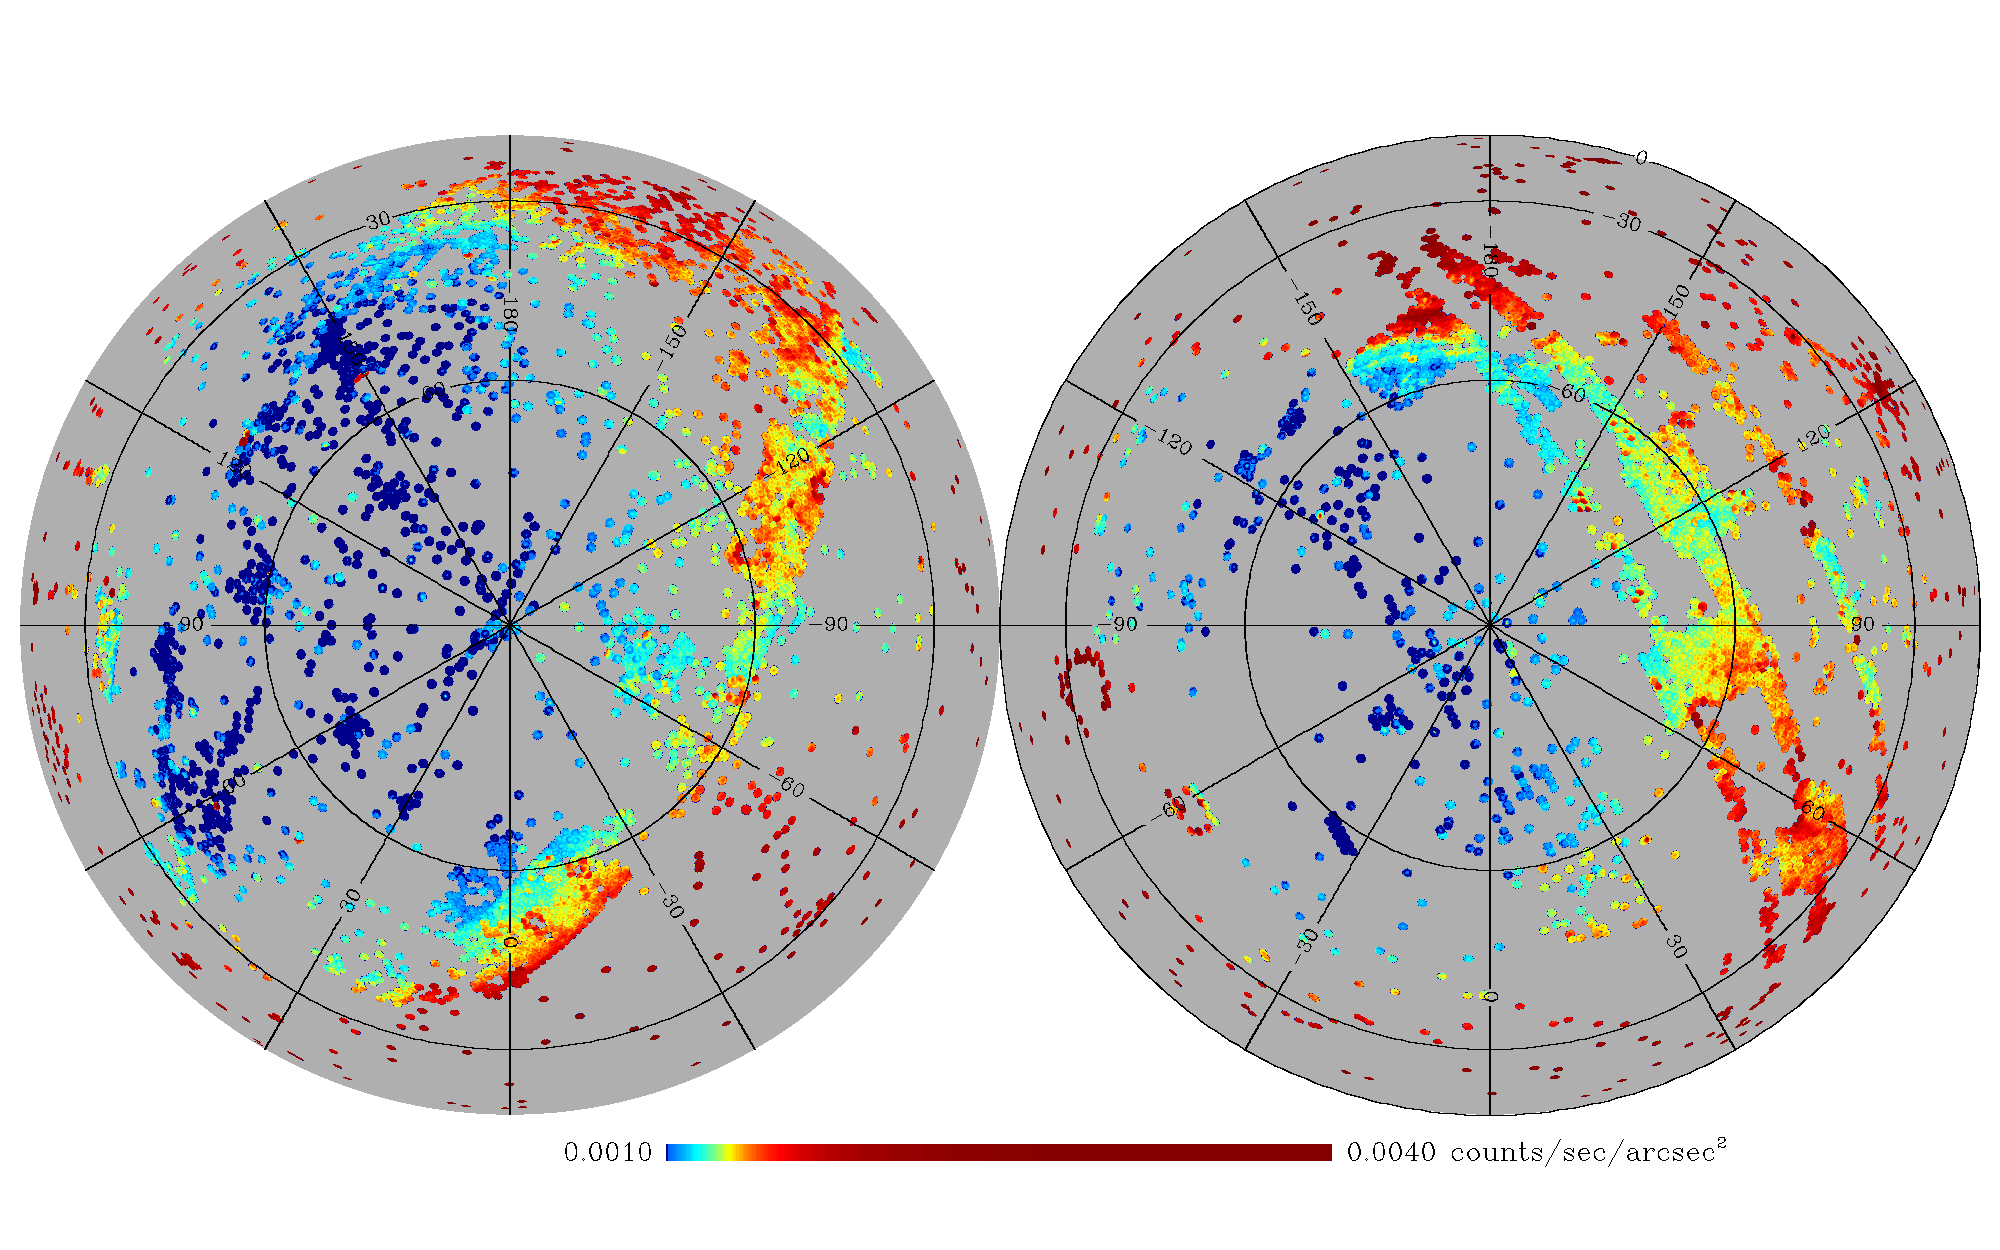
The sky background maps in Galactic coordinates for the all-sky and medium imaging surveys are shown in Figures 1 and 2 to illustrate the sky coverage available in the GR6 data release. The numerous gaps in the sky coverage of the all-sky survey are due to the Galactic plane, bright stars, and other high count rate sources such as the Magellanic Clouds. These areas were avoided in order to prevent damage to the detectors. The medium imaging data mainly targets regions that were a part of the Sloan Digital Sky Survey, the Two Degree Field Redshift Survey, the WiggleZ survey, and many other smaller surveys targeting various individual sources of interest.
Source Selection and Definition of Primary Designation
The two largest surveys undertaken by GALEX are the All-Sky and Medium Imaging Surveys (AIS and MIS respectively) and they make up the bulk of the catalogs presented here. The typical exposure time for the all-sky survey is about 100 sec while that for the medium survey is one eclipse, or approximately 1500 sec. However, exposure times vary above and below these values within each survey. While much shallower, the AIS covers a much larger area of sky. Although the vast majority of medium survey tiles also have all-sky survey coverage, we decided to keep the two surveys separate in order to create a somewhat more uniform all-sky survey data set. Examination of the exposure time per tile revealed a minimum in the distribution at around 800 sec. We choose this as the dividing line between the GASC and GMSC. We have also included any observations from other GALEX surveys, such as the Nearby Galaxy Survey (NGS), calibration targets (CAI), Guest Investigator (GI) observations, etc. The inclusion of these additional surveys means that certain classes of objects targeted by these data sets, such as large nearby galaxies for example, will be over represented in the data.
The GMSC was limited to observations no longer than 10,000 sec. One reason for this choice is that the de-blending parameters used by the SExtractor program were set differently for images with total exposure times greater than 10,000 sec in an attempt to alleviate the effects of blending and crowding in the images. We wanted to avoid having huge jumps in the exposure time map on the sky as well. For those tiles with total exposure times in excess of 10,000 sec, we replaced those data by the single visit to that tile with the largest exposure time.
The sources in these catalogs are NUV-selected, and the fluxes for a given object are taken from an existing MCAT flux. Which MCAT value to use for a given source, when there are multiple choices, is defined by a "primary designation", or, a "primary region". After compiling the list of tiles belonging to various GALEX surveys (AIS, MIS, GI, etc), we then proceeded as follows to select the primary region within each tile. We first sorted the list in order of decreasing FUV exposure time and then secondarily on the NUV exposure time. The entire area and catalog of the first tile is labeled as primary. Then we stepped down the list of tiles and for each found the portion of sky covered by that tile that was not previously counted as primary from an higher priority tile in the list. The end result is that we obtain the deepest FUV exposure time available for each portion of sky (where FUV data are available) while simultaneously removing duplicate observations of the same portion of sky. At each step we update the footprint files so that it matches the cataloged sources selected as primary.
Both the GASC and GMSC are a NUV-selected catalog. We select sources that are detected in the NUV and that have an NUV signal-to-noise ratio greater than three (S:N NUV > 3). For those tiles with FUV observations, we make use of the "fd-ncat" files produced by the GALEX pipeline. These are measurements on the FUV image using the NUV positions and aperture definitions. As a consequence, there are no FUV-only sources in the GASC, GMSC, or Kepler GCAT. The main motivation for this choice is that an examination of the FUV-only sources in the GALEX archive revealed that the vast majority of these sources are spurious. However, there may be a handful of real FUV-only sources that will not appear in these catalogs. Users interested in such sources should search the full GALEX archive at MAST. This choice has the additional advantage that the FUV is measured over the same region of sky as the NUV and results in the most accurate FUV-NUV colors. This does mean that the FUV fluxes measured are not always statistically significant, and can in some cases be negative. Users can assess the significance of a FUV measurement using the FUV signal-to-noise ratio saved in the S2N_FUV column in the catalog. Sources that have no FUV observations can be identified by the value listed in the EFF_EXPTIME_FUV column which will have a value of -99.0. Values of -99.0 will also be placed in all of the FUV magnitude and flux columns for these sources as well.
Flags
There are three different flags available in the catalogs that denote sources and regions of the sky in which there may be artifacts or other problems with the sources detected there. The standard flags output by the GALEX pipeline are saved in the ARTIFACT_NUV and ARTIFACT_FUV columns. These flags are represented as a series of binary bits and are the logical "OR" of all of the flags set at the location of the source centroid. Here is a listing of each flag value and a brief description of their meaning. The number in parentheses is the decimal equivalent of the binary bit.
- ( 1): edge; Detector bevel edge reflection (NUV only).
- ( 2): window; Detector window reflection (NUV only).
- ( 4): dichroic; Dichroic reflection.
- ( 8): varpix; Varible pixel based on time slices.
- ( 16): brtedge; Bright star near field edge (NUV only)
- ( 32): Detector rim(annulus); proximity(>0.6 deg fld ctr)
- ( 64): dimask; dichroic reflection artifact mask flag
- (128): varmask; Masked pixel determined by varpix.
- (256): hotmask; Detector hot spots.
- (512): yaghost; Possible ghost image from YA slope. This is only relevant for data taken after the completion of GR6.
Please consult the general GALEX documentation for images and other details about many of these artifacts, e.g., Chapter 4.
For most of these flagged regions, there is likely nothing wrong with the images or detected sources. Flag numbers 4, 7, 8, and 9 indicate regions where various types of artifacts have been removed. Artifact flags 1 and 5 were originally intended to flag reflections from bright stars that appear near the edge of the field of view. However, these flags are not very reliable and most of the time flag regions where there are in fact no artifacts. Flag number 6 indicates proximity to the edge of the field-of-view but this flag is only set for a small fraction of sources in the GASC or GMSC. For most purposes, we recommend excluding any sources with either of the following flags set: number 2 (NUV bright star window reflection) or number 3 (dichroic reflection). To determine whether a particular flag was set or not, take the bitwise "and" between the artifact column and the value of the flag. For example, in IDL the expression (artifact_nuv and 4) will return a value of 4 if the dichroic reflection flag is set or 0 if not.
We have tuned the deblending parameters in the SExtractor program to correctly measure most galaxies up to one arcminute in diameter. Galaxies larger than this will have a larger probability of being shredded into multiple sources by the GALEX pipeline. So that users can avoid these shredded galaxies in the catalog, we have included the "EXTENDED" flag in the catalog for known optical sources with diameters (typically 25th magnitude isophote optical diameters, D25) greater than 1.5 arcminute. If a source in the catalogs lies within an elliptical aperture with major axis scaled to 1.25*D25, then we set EXTENDED equal to one and zero otherwise.
There are additional artifacts due to bright stars lying just off of the field-of-view that are not in general flagged by the standard GALEX pipeline. These artifacts are in general shaped like horseshoes or long, thin cones. We have visually inspected all of the primary regions of both the GASC and GMSC and have manually identified these artifacts. For any source that lies within one of these flagged regions, the column MANFLAG will be set to one. In addition bright stars can can create thin elliptical sources somewhat resembling an edge-on galaxy that lie perpendicular to the edge of the field-of-view. We have tried to use the location and shape parameters in the catalogs to flag such sources. Any source that is likely one of these artifacts will have MANFLAG set equal to two.
Footprints
We have chosen to represent the GALEX footprint in the healpix format. Please see the healpix web site for more information: http://healpix.jpl.nasa.gov/. Healpix provides a way of covering the sphere in a series of equal area regions (or pixels). The lowest resolution pixelation of the sphere contains 12 base pixels. The resolution of a particular Healpix grid is specified by the parameter Nside which defines the number of divisions along the side of a base pixel necessary to reach the desired resolution. Healpix supports two pixel numbering/indexing schemes, called ring and nested. We have made use of the nested scheme with Nside=16384. At this resolution, the area of each pixel is 12.882 arcsec2. For convenience we also provide fullsky maps at 3.442 arcmin2 (nside = 1024) and 51.532 arcsec2 (nside=4096) resolution.
Healpix fits files consist of a header and a binary table which always contains four arrays labeled pixel, signal, n_obs, and serror. The header contains the coordinate system (celestial or galactic) and Nside, both of which are needed to translate a healpix pixel index into a pixel on a sphere. The pixel array always contains the healpix pixel number.
The full footprint consists of several complimentary healpix fits files for both the FUV and NUV. The various healpix maps are listed in the table below along with the corresponding column in the catalog. The units column gives the units of the signal array in the file. The footprint and coverage map are built using the GALEX pipeline high resolution relative response (rrhr) image, while the flagmap is built using the GALEX pipeline flags image. It should be noted that the GALEX pipeline flags image product is at lower resolution than the rrhr image.
| Summary Of Healpix Maps | |||
| Map Name | Column In Catalog | Units | Description |
| Coverage Fraction | None | fraction | This give the fraction of each healpix pixel that has coverage within GALEX. It will differ from one near the boundaries of the sky coverage or between adjacent GALEX tiles. |
| Relative Response | EFF_EXPTIME_NUV, EFF_EXPTIME_NUV | seconds | Map of the average effective exposure time within a healpix pixel. The effective exposure time is defined as the exposure time multiplied by the flat field. |
| Sky Background | BKGRND_FLUX_NUV, BKGRND_FLUX_FUV | micro-Janskys per square arcsec | The average sky background measured by the GALEX pipeline within each healpix pixel. |
| Flag | ARTIFACT_NUV, ARTIFACT_FUV | number | Map giving the value of the standard GALEX pipeline flags set within a healpix pixel. |
| Extended Flag | EXTENDED | number | Map of the large extended source flag. Flagged regions denote regions covered by large extended sources such as nearby galaxies and globular clusters. |
| Manual Flag | MANFLAG | number | Map of manually flagged regions. These are regions contaminated by reflections from bright stars. |
Coverage Map or Covering Fraction Map
The coverage map indicates the fraction of the area of each healpix pixel that has GALEX primary coverage. The coverage fraction is stored in the 'signal' array and the other two arrays are not populated (they are set to 0 by healpix). Summing the coverage fraction across all pixels in a map and multiplying by the healpix pixel area is one method for computing the total area of the footprint. The coverage fraction is also important for studies analyzing the spatial distribution of GCAT sources. While the relative response map contains the effective exposure depth in a healpix pixel, the coverage fraction multiplied by the healpix pixel area indicates the area of sky that was covered at that depth. The coverage map is thus an integral part of the footprint.
The coverage fraction tends to exceed 1 on the boundaries of tiles due to slight imprecision in the primary determination. Since duplicate sources have been removed, it is acceptable to cap the coverage map at a value of 1.0.
Relative Response or Effective Exposure Time
The signal array in the footprint map contains the average effective exposure time in each healpix pixel. This average is taken over all GALEX high resolution pixels (1.52 arcsec2) whose centers fall within the healpix pixel. These GALEX high resolution pixels are said to 'belong' to the healpix pixel. The footprint is the only map in which all four healpix arrays (pixel,signal,n_obs,serror) have been populated. In addition to 'signal', 'n_obs' contains the number of primary GALEX high resolution pixels that belong to the healpix pixel. Serror contains the variance in the effective exposure time within each healpix pixel; that is it contains the standard deviation of the effective exposure times in the primary GALEX high resolution pixels belonging to the healpix pixel from the average in that healpix pixel, divided by the square root of n_obs. For some applications, it may be desirable to exclude healpix pixels with a high serror.
Flag maps
There are three complimentary healpix tables giving maps of various types of flagged regions within the data: the flag map, extended flag map, and the manual flag map. We describe each of these below.
Flag Map
The flag map is essentially a bit map and the meaning of each bit is the same as in the GALEX flag image pipeline products and in the GASC and GMSC catalogs, as described above (ARTIFACT_NUV or ARTIFACT_FUV). Due to the constraints of healpix, the bit map is stored as a float in the 'signal' array of the healpix flagmap. To use this map, the signal array should be fixed or cast to an integer type.
A set flag in a healpix pixel indicates that the area belonging to the healpix pixel is either partially or completely flagged in the higher resolution GALEX pipeline flags image. This is accomplished by performing a bitwise "OR" across the flag values of all GALEX high resolution pixels belonging to each Healpix pixel. In order to ensure consistency between the exposure time footprint and the flagmap, the GALEX flags image is upgraded to the higher resolution of 1.5 arcsec/pixel before the healpix flagmap is built. This is done by dividing every flag image pixel into smaller pixels while retaining the original flag values. That is, the effective resolution is not increased, but the flagged area is appropriately spread across the healpix pixels so that no flagged area escapes.
Extended and Manual Flag Maps
The EXTENDED and MANFLAG flags described above each have their own healpix map indicating regions of the sky where sources have these flags set. By referencing the Healpix pixel values, a flagmap may be used to mask the footprint and coverage fraction map, thus creating a new, cleaned, footprint. The catalog must be treated in a similar matter, and for this and other purposes the catalog includes a column containing the pixel index of the healpix pixel in which the centroid of each source resides.
Example Footprint Maps
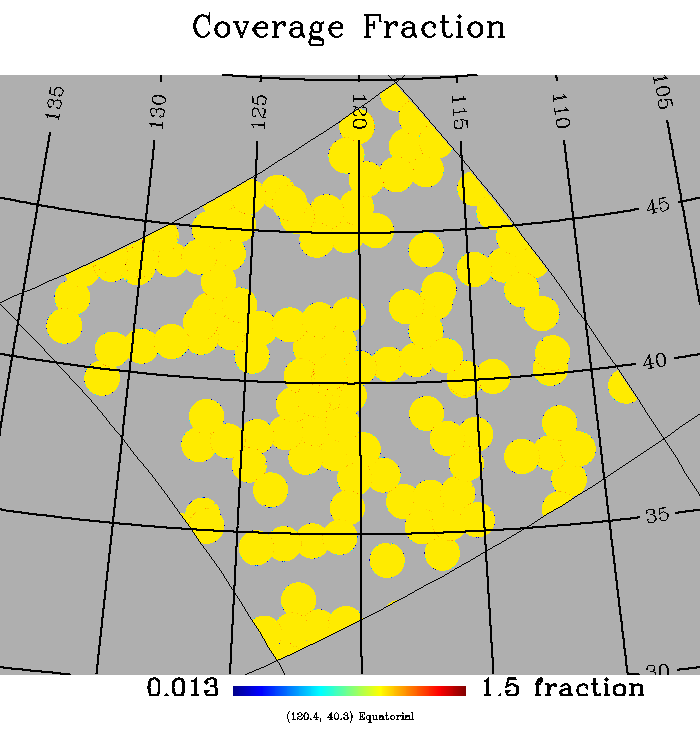
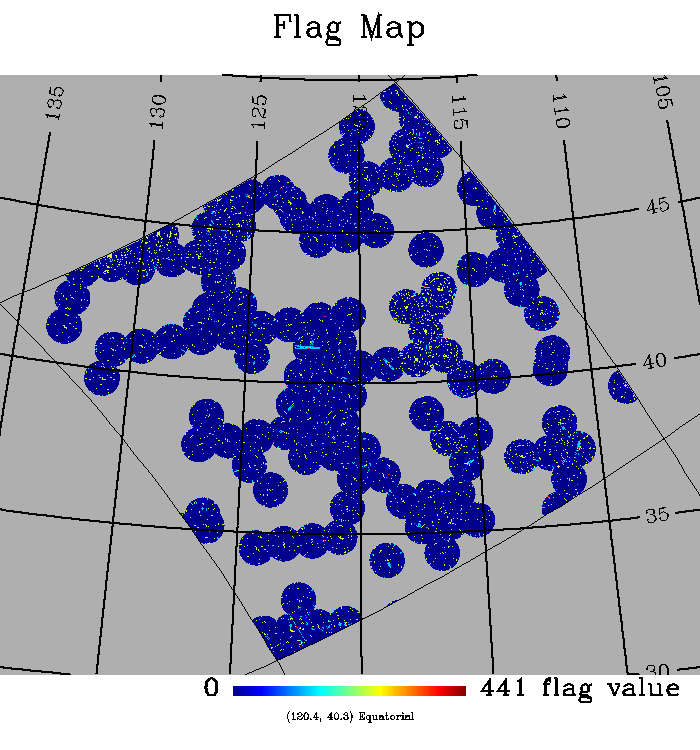
We illustrate the content of the footprint maps with the plots below. We have divided the catalog into smaller regions 215 deg^2 in size, called "chunks," which correspond to healpix pixels at the Nside=4 level. Below we plot the coverage fraction, effective exposure time, flag map, and manual flag map in the NUV band for chunk 111 centered near RA = 8h and Dec = +40 deg in Figure 3-6.
|
|
|
Figure 3: The NUV coverage fraction of the data for chunk 111 in the MSC. Most of the observed area has a coverage fraction of 1 with lower and higher values occurring at the borders of individual GALEX tiles.
|
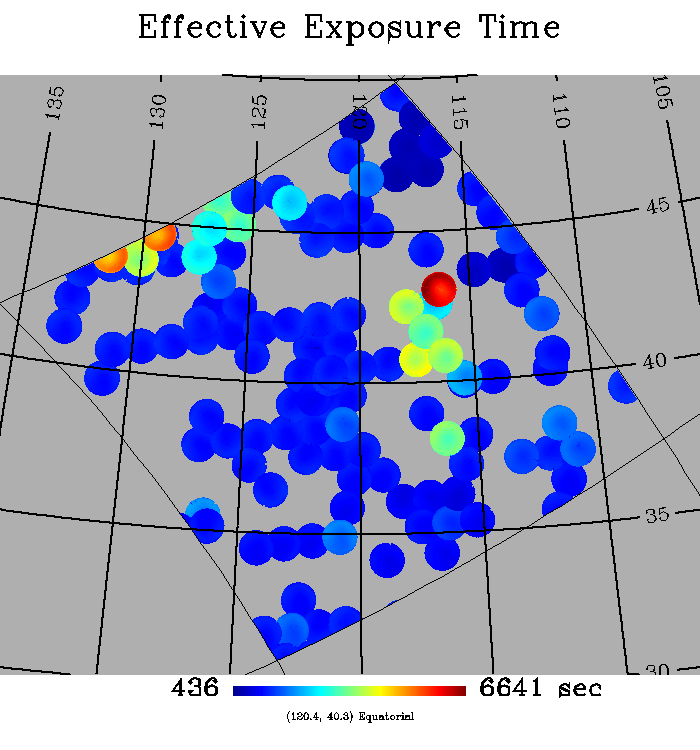
Figure 4: The NUV effective exposure map in the MSC for chunk 111 in seconds. The effective exposure time can go below the nominal MSC limit of 800 sec because the effective exposure time includes both the exposure time and the flat field.
|
|

|
|
Figure 5: The NUV flag for chunk 111 in the MSC. While a significant portion of the area has a flag value set, only a small fraction of these regions likely represent regions which should be avoided. See the previous discussion in the Flags section in the text.
|
Figure 6: The plot of the manual flag for chunk 111 in the MSC.
|
Example Footprint Calculation in IDL
Below is sample code for computing the total footprint area. In this example, we are including all sources regardless of their exposure time. We exclude sources with either the dichroic or window reflection flags set as well as any sources with the MANFLAG or EXTENDED flags. Summing the coverage fraction for all healpix pixels which satisfy these criteria and multiplying by the pixel area (12.88 arcsec^2, or 1.28 x 10^-5 deg^2), then gives the footprint area. Note that the coverage fraction map contains values greater than 1.0 along the boundaries between individual GALEX tiles. We first cap the coverage fraction at 1.0 before computing the sum. The flag maps are stored as floating point numbers and thus should be first recast as integers before testing them. This code assumes that the catalog has been read into a structure "g" while the coverage fraction, flag, extended, and manflag maps have been read into the structures covfrac, flag, extended, and manflag, respectively.
use = where( ((g.artifact_nuv and 2) eq 0) and $
((g.artifact_nuv and 4) eq 0) and $
(g.extended eq 0) and (g.manflag eq 0) )
gselect = g[use]
good = where( (covfrac.signal gt 0) and $
((round(flag.signal) and 2) eq 0) and $
((round(flag.signal) and 4) eq 0) and $
(round(extended.signal) eq 0) and $
(round(manflag.signal) eq 0) )
sum = 0.0
for i=0L,n_elements(good)-1 do sum = sum + min( [covfrac[good[i]].signal, 1.0] )
pixarea = (12.88/3600.0)^2
area = sum * pixarea
Note that the footprint selected in this way will not match exactly the healpix pixels in the source list. The reason is that the healpix pixel boundaries do not cleanly lie along the boundaries of the high resolution pixels or flagged regions in the GALEX images. For example, a source may not have a particular flag set in its artifact_nuv column but may lie close enough to a flagged region such that the healpix pixel it lies within does overlap with the flagged region. In that case the source would survive the cut but the healpix pixel listed in its "hp_pixel" column would not appear in the footprint. The same can happen for the extended and manflag columns as well. Users who wish the footprint and source list to match exactly, should follow a slightly different procedure. They should first select the regions they want to include using the footprint files. Then the catalog can be searched for all sources that lie within those healpix pixels in the selected footprint.
Back To Top
|
|
|