Example JTPS global map from 2012 in the F763M filter.
JTPS (AR-14585) is an investigatation of the spectral power in Jupiter’s cloud features and zonal winds. To complete this project, analyses were done on full global Jupiter maps acquired in many epochs. Several of these are tied to projects with their own HLSP pages (see table below). However, some maps have not been previously archived and are provided here. Although initial analyses were performed only on red and near-IR images, all available maps have been posted.
The maps are generated by stitching together images from consecutive HST orbits to cover all longitudes of the planet as it rotated. Full global maps require 5-6 HST orbits to span Jupiter’s full 10-hour rotation. To make a complete map, individual images are navigated with iterative ellipsoid limb fitting and mapped at 0.1 deg/pixel over +/- 79.8 deg of latitude and centered on the central meridian longitude. Minnaert functions are applied to reduce limb effects, using empirical fits to the k coefficient, ranging from ~0.5 to 0.999 at UV to near IR bands, respectively, but maps before 2014 do not contain absolutely calibrated reflectance. To generate a global map, individual maps are joined at overlapping longitudes, and seams are smoothed with a weighted average at the map edges, typically over ~20 pixels. The seams are most easily observed at high latitudes in filters that are sensitive to high altitude hazes above the cloud deck (UV and methane gas absorption band filters). Note that maps from data before 2009 use WFPC2, which suffered significant vignetting in the methane quad filters (FQCH4P15 and FQCH4N15). You can refer to the full set of JTPS observations using the DOI http://dx.doi.org/10.17909/t9-cfke-ps60.
Each FITS file name follows a syntax of "hlsp_jtps_hst_{ins}_jupiter-{epoch}_{filter}_v1_globalmap.fits", where:
{ins} = Name of instrument, either "wfpc2" or "wfc3-uvis".
{epoch} = Epoch of observations, a calendar year plus a letter to differentiate between observation sequences taken with the same calendar year, example: "1995b". Always consult the FITS header for the full timestamp information of the observations (start and end of the constituent exposures).
{filter} = Name of HST filtr used, e.g. "f410m".
There are also .tif image previews in a variety of sizes ("_globalmap.tif" are the largest, with "globalmap-medium.tif" and "globalmap-small.tif" also available).
You can retrieve the images and previews from the table below, or directly at this URL. The links in the Date column will display global maps produced by the JTPS in the display area below. Those maps with origins in other HLSP can be accessed following the links under the Program column.


 Follow Us
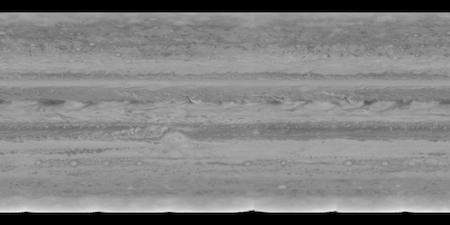 Example JTPS global map from 2012 in the F763M filter.


