


 Follow Us
Jump To: Kepler KOI List
Upload A Target List: Kepler KOIs
This tutorial will show you how to upload a list of targets into the MAST Portal. Specifically, we will upload a list of Kepler Objects of Interest (KOIs). We will then perform a spatial cross-match against the TESS Candidate Target List (CTL) to obtain a list of Kepler KOIs that are in the CTL. The file used in this example is available for you to download here.
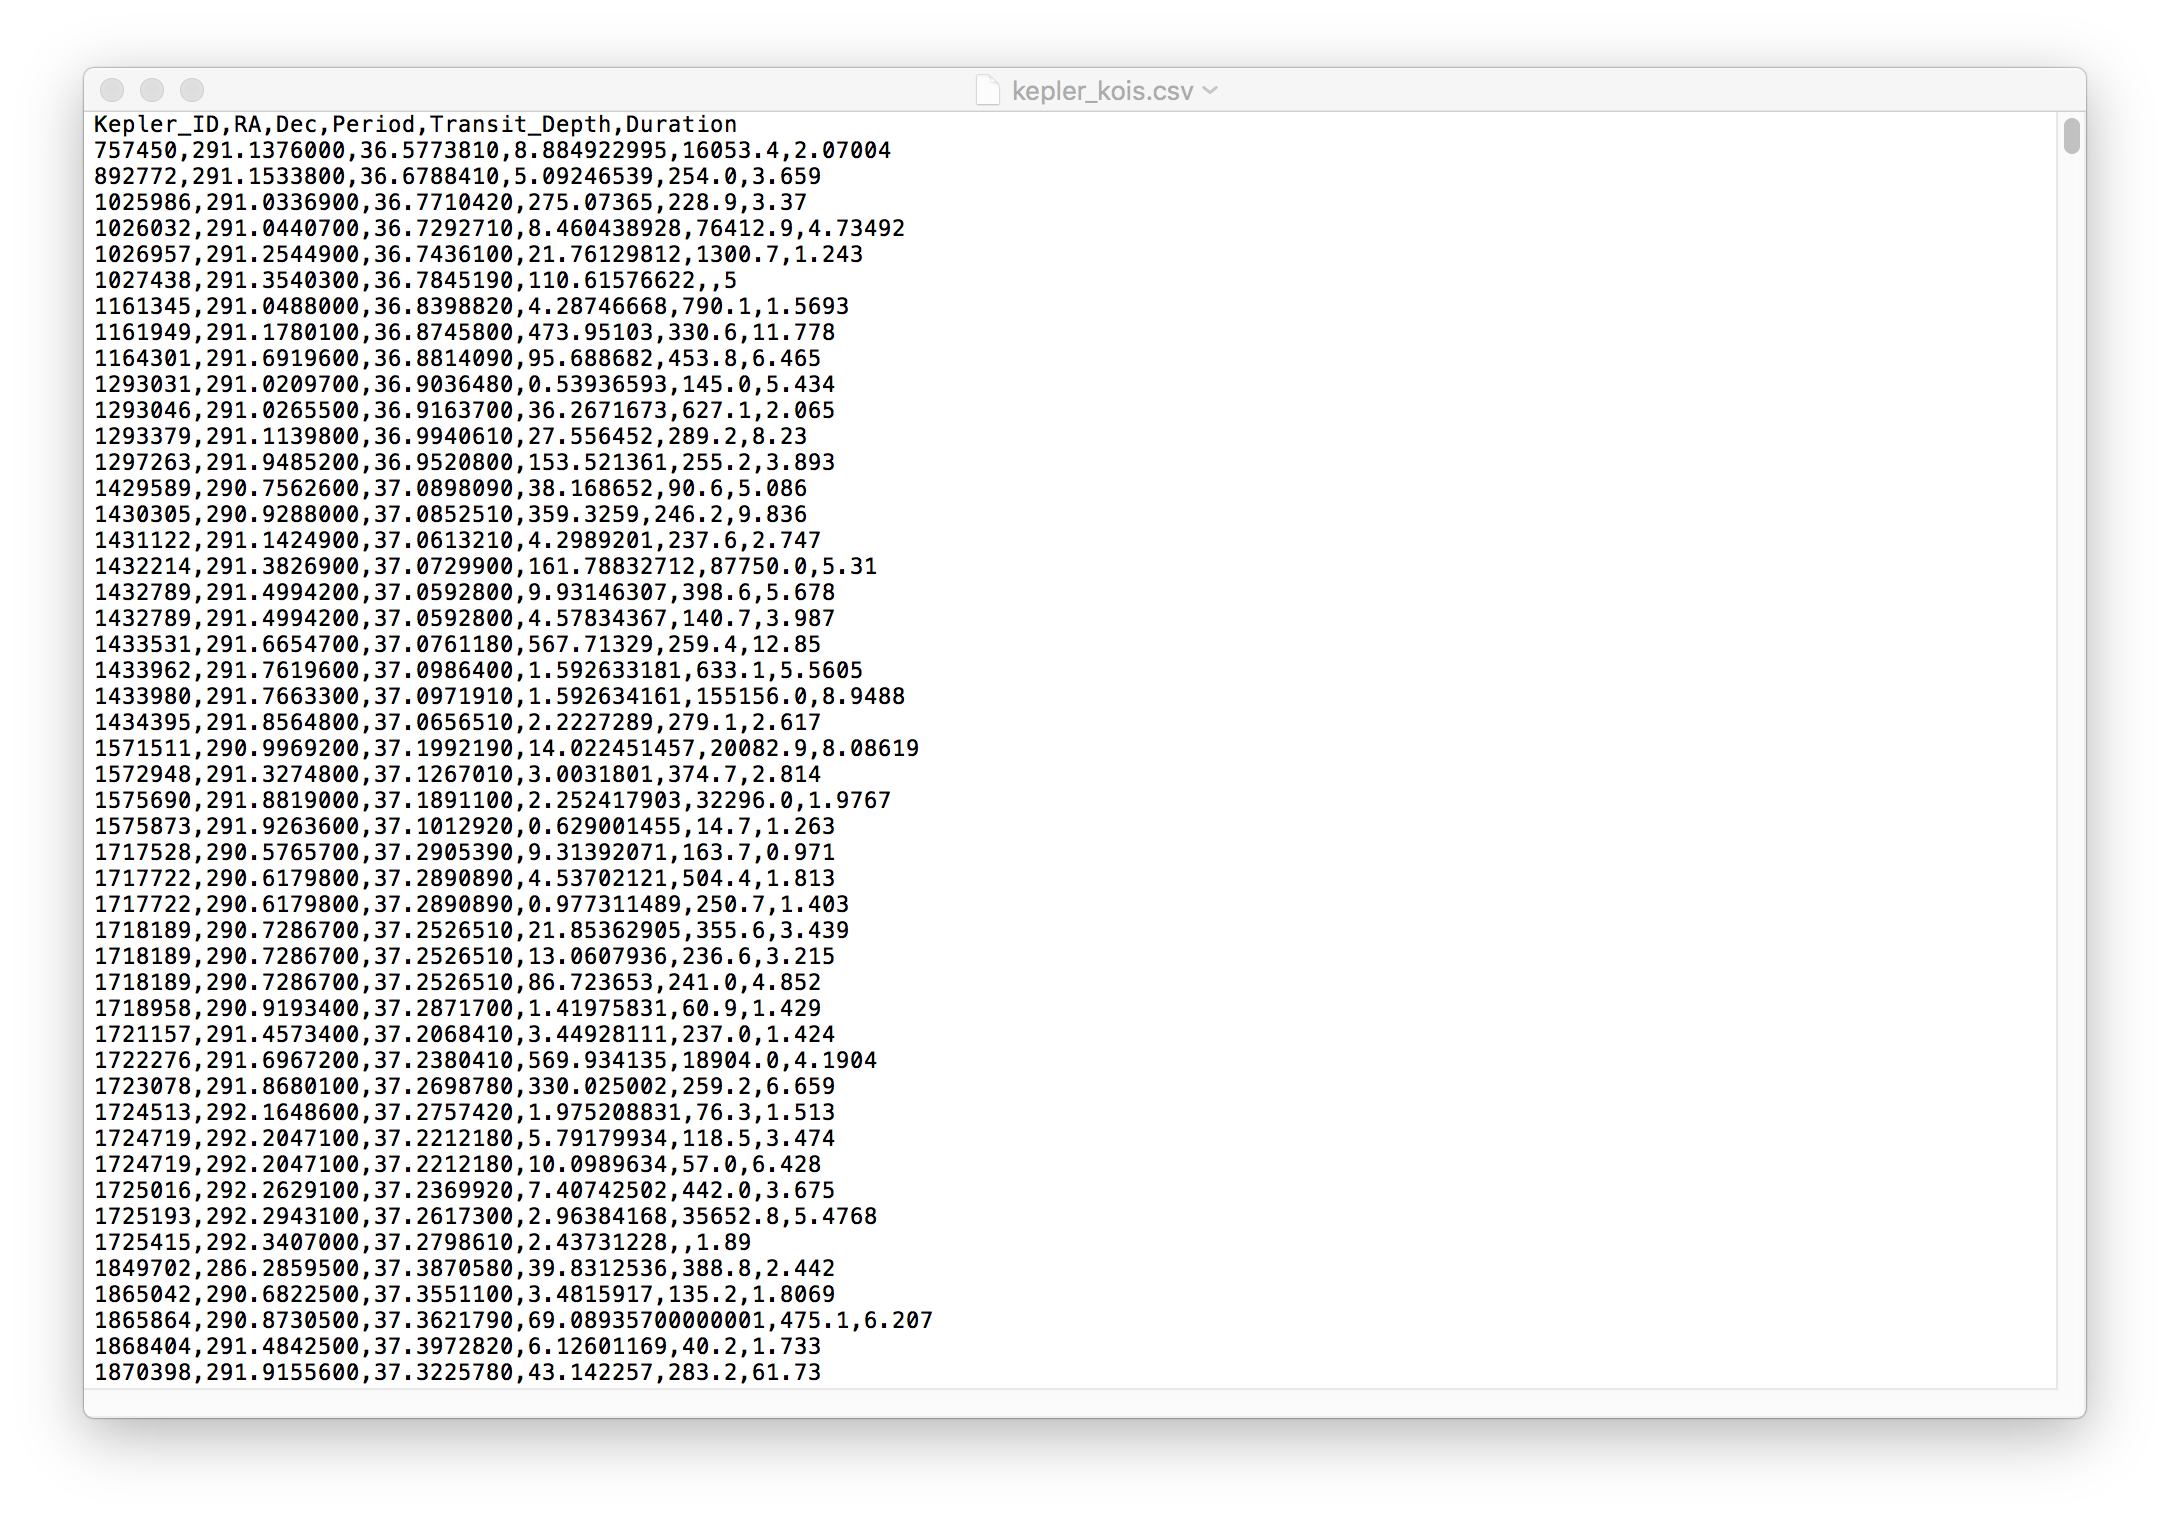
| The Portal can accept target lists in a variety of formats. One of the most basic formats is a comma-separated values (CSV), where columns are split by using a comma. Our file contains a list of Kepler KOI IDs, RAs, DECs, orbital periods, transit depths, and transit durations. Hint: If your uploaded list of targets includes columns called RA and DEC, then the Portal will automatically recognize them as coordinates and allow you to use more tools with your list of sources, like the AstroViewer and spatial cross-match tool. Your target list can include anything you want, however, and once uploaded, you can use Portal tools like the plotting tool on any column in your uploaded table. |
 |
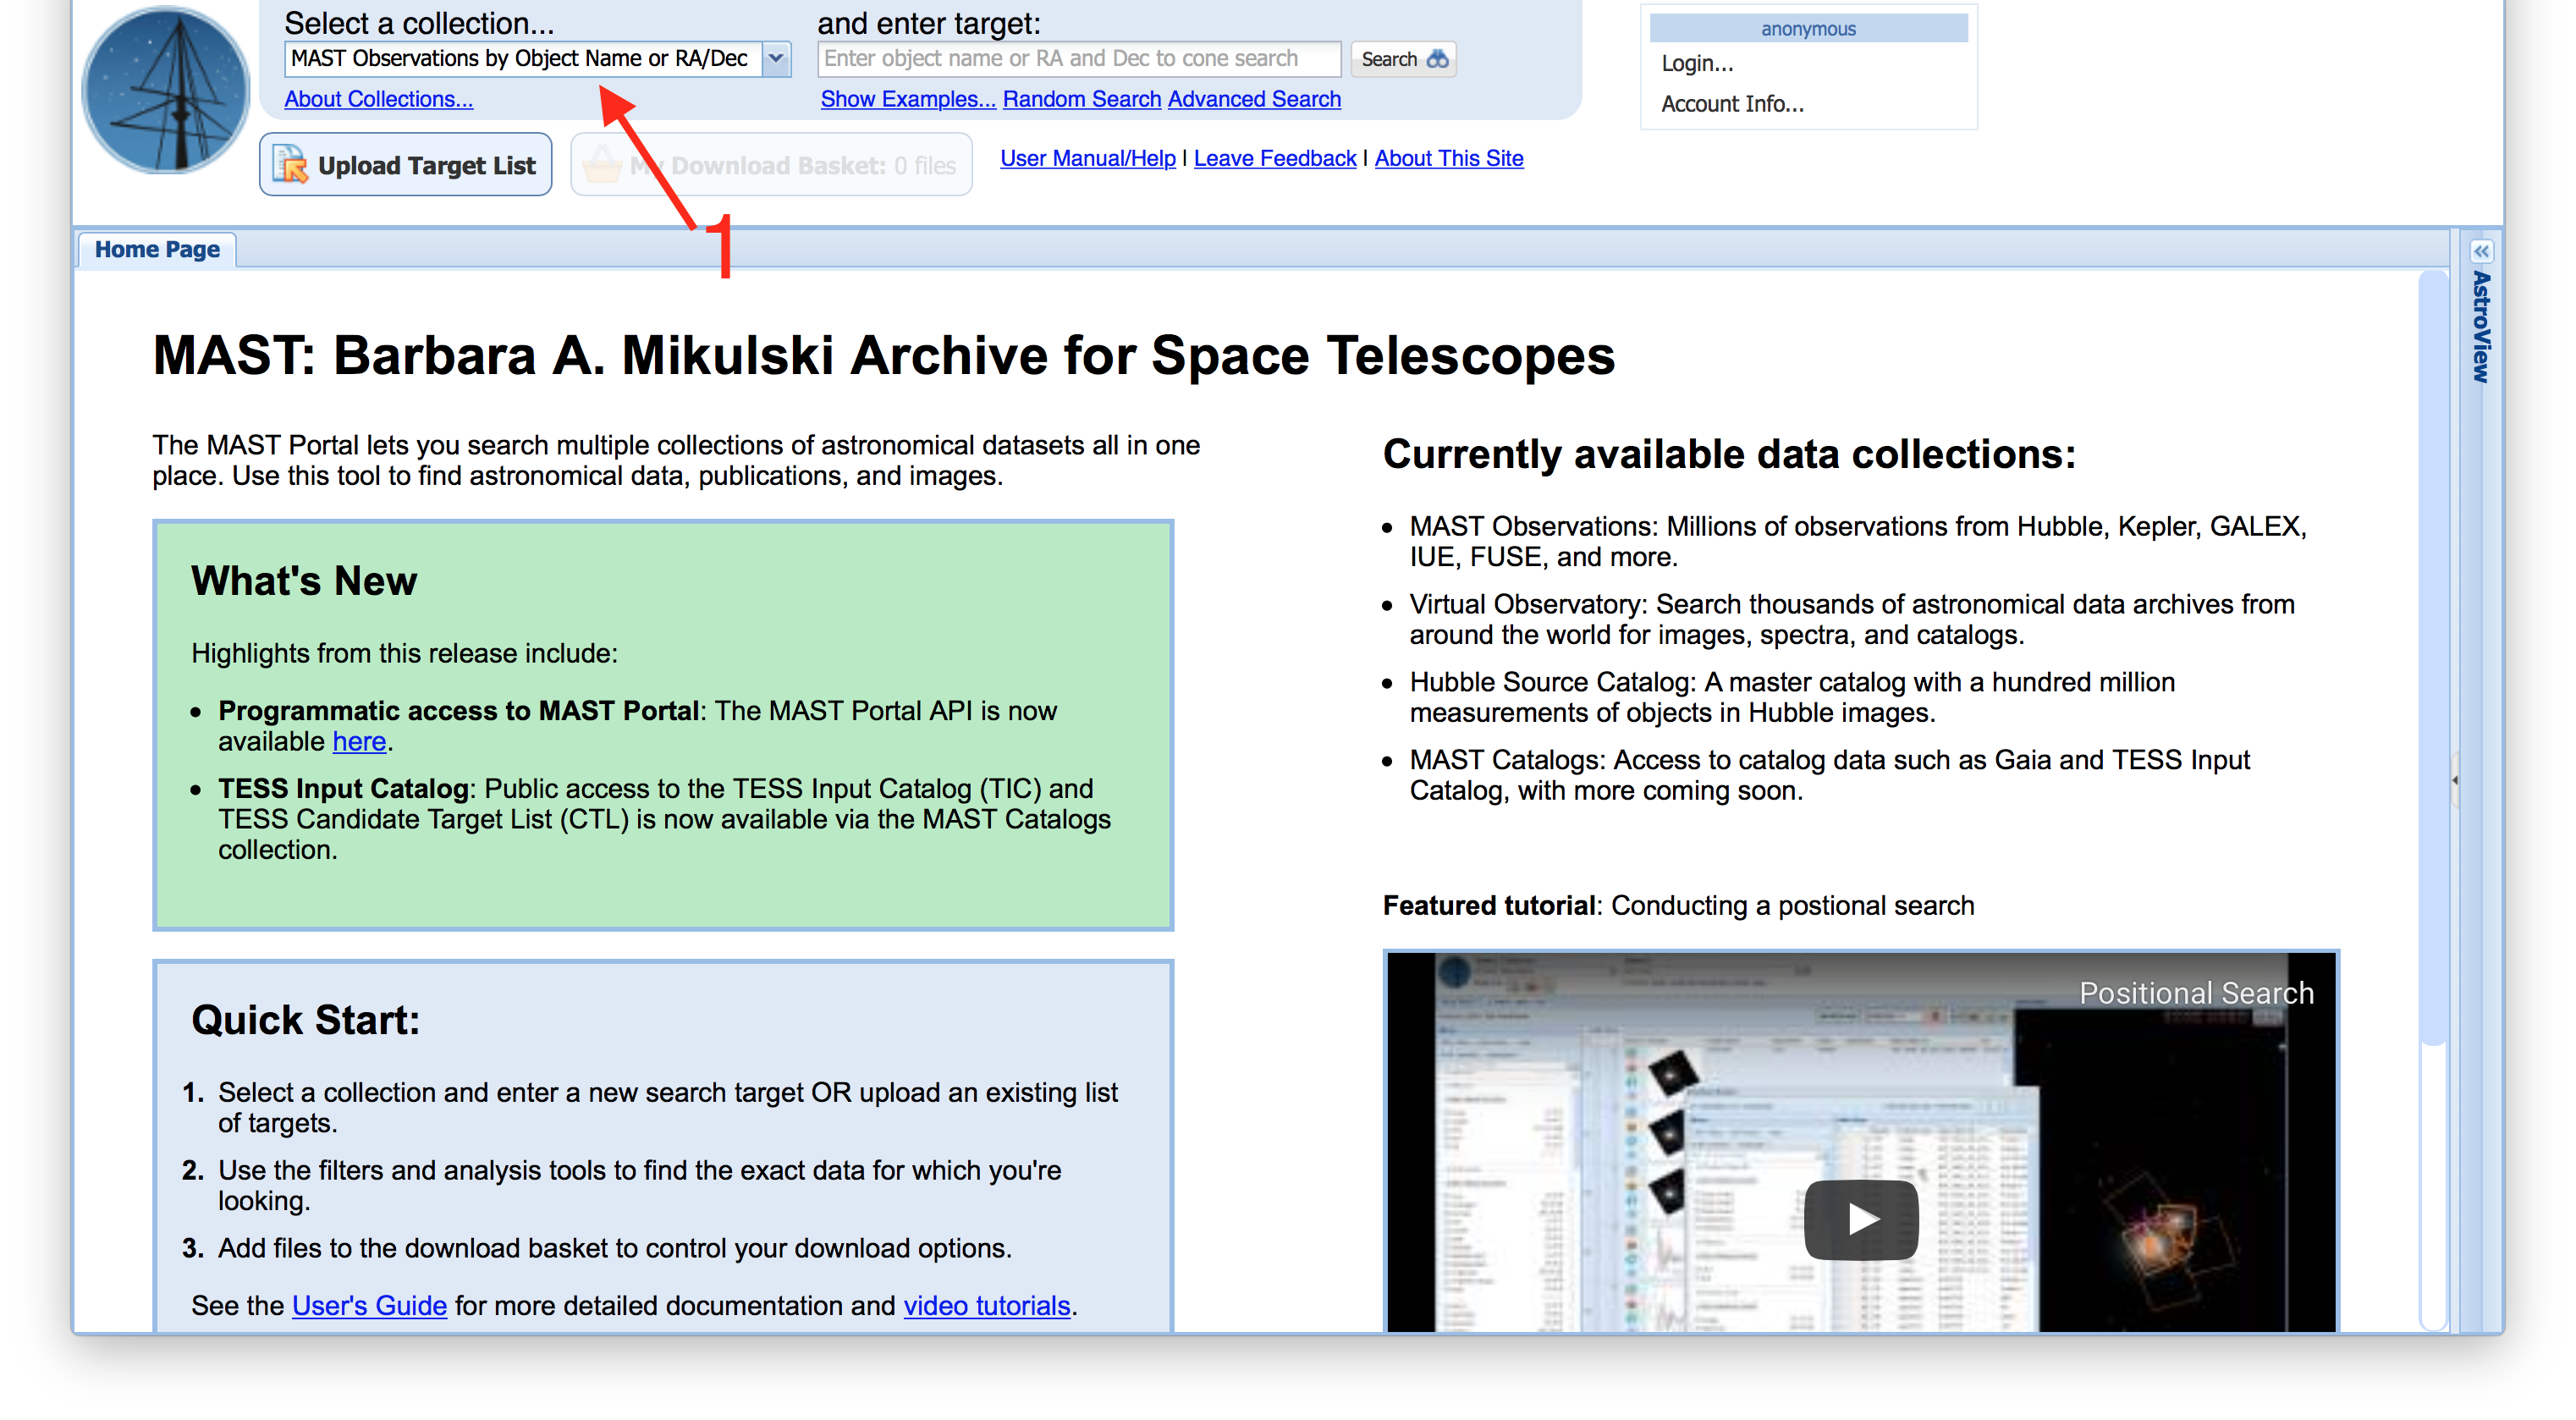
| Upon visiting the MAST Portal, the first step is to change the collection of data we are searching in from the Context menu (Item #1) at the top left. |
 |
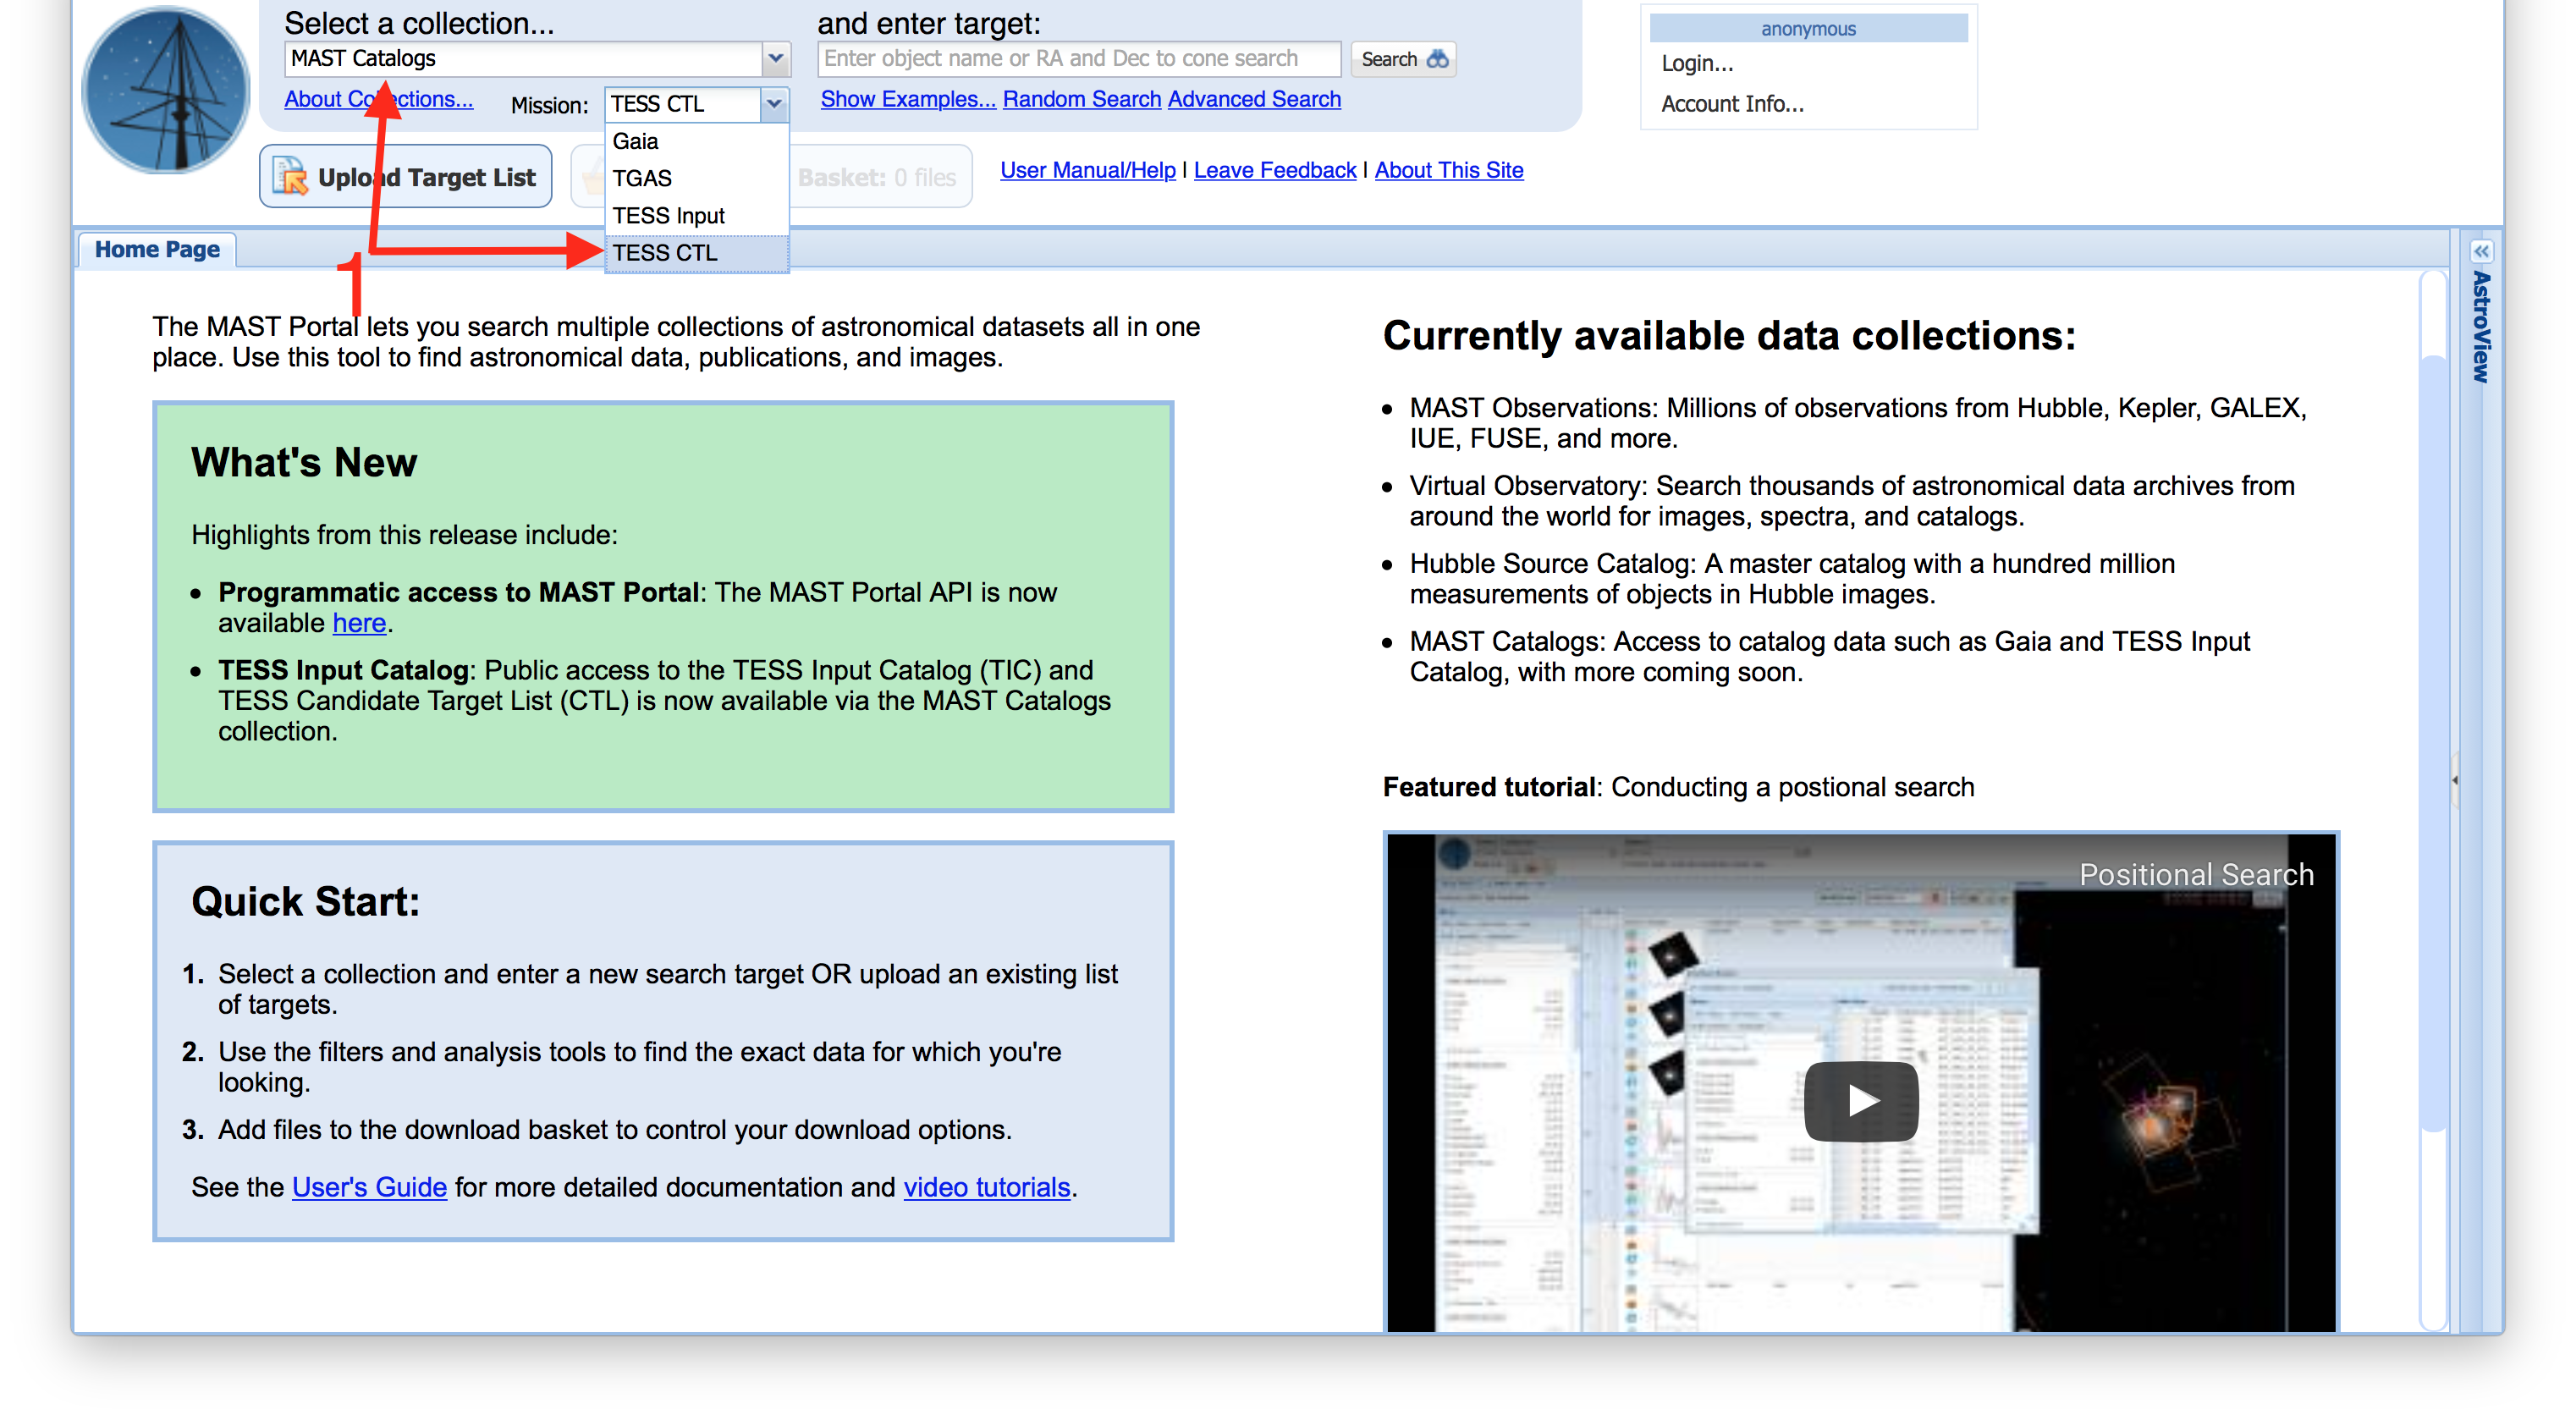
| From the Context drop-down menu, select MAST Catalogs, then, in the Mission drop-down menu that appears (Item #1), select either TESS Input for the TIC, or TESS CTL for the candidate target list. In this example, we'll select TESS CTL. |
 |
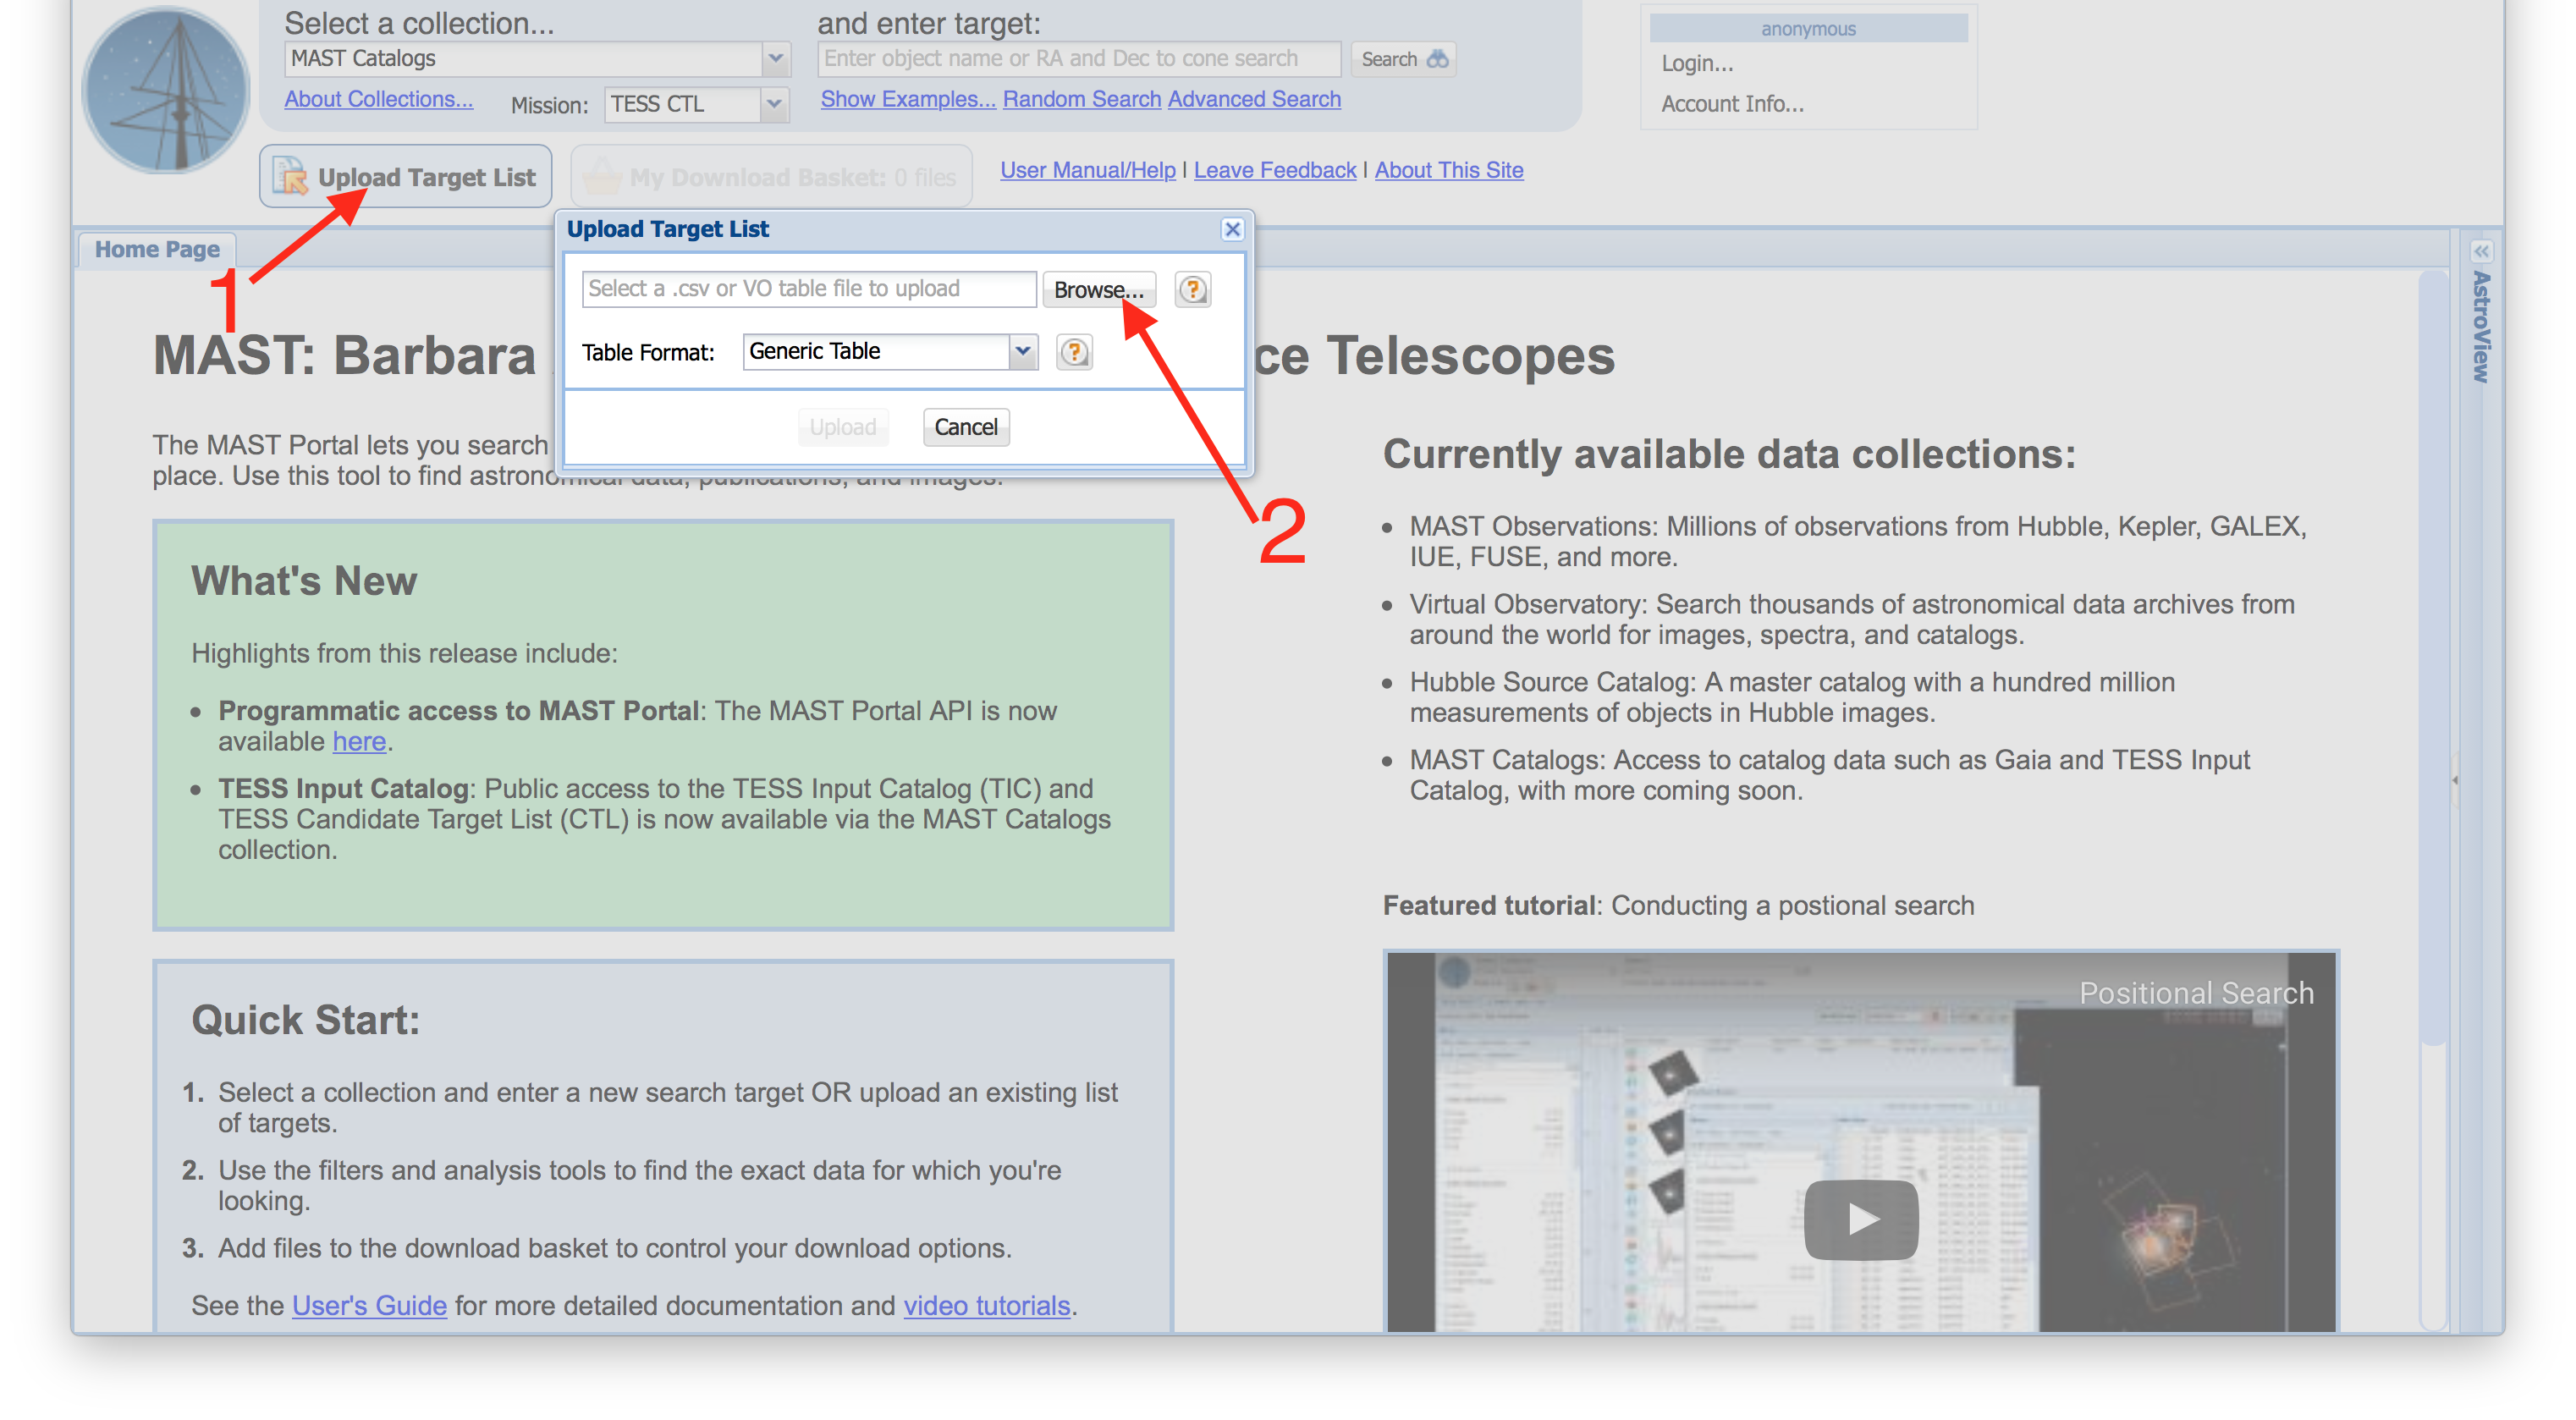
| Now we'll upload our list of targets. Use the Upload Target List button (Item #1), and then select your input file using the Browse button in the dialog menu that appears (Item #2). |
 |
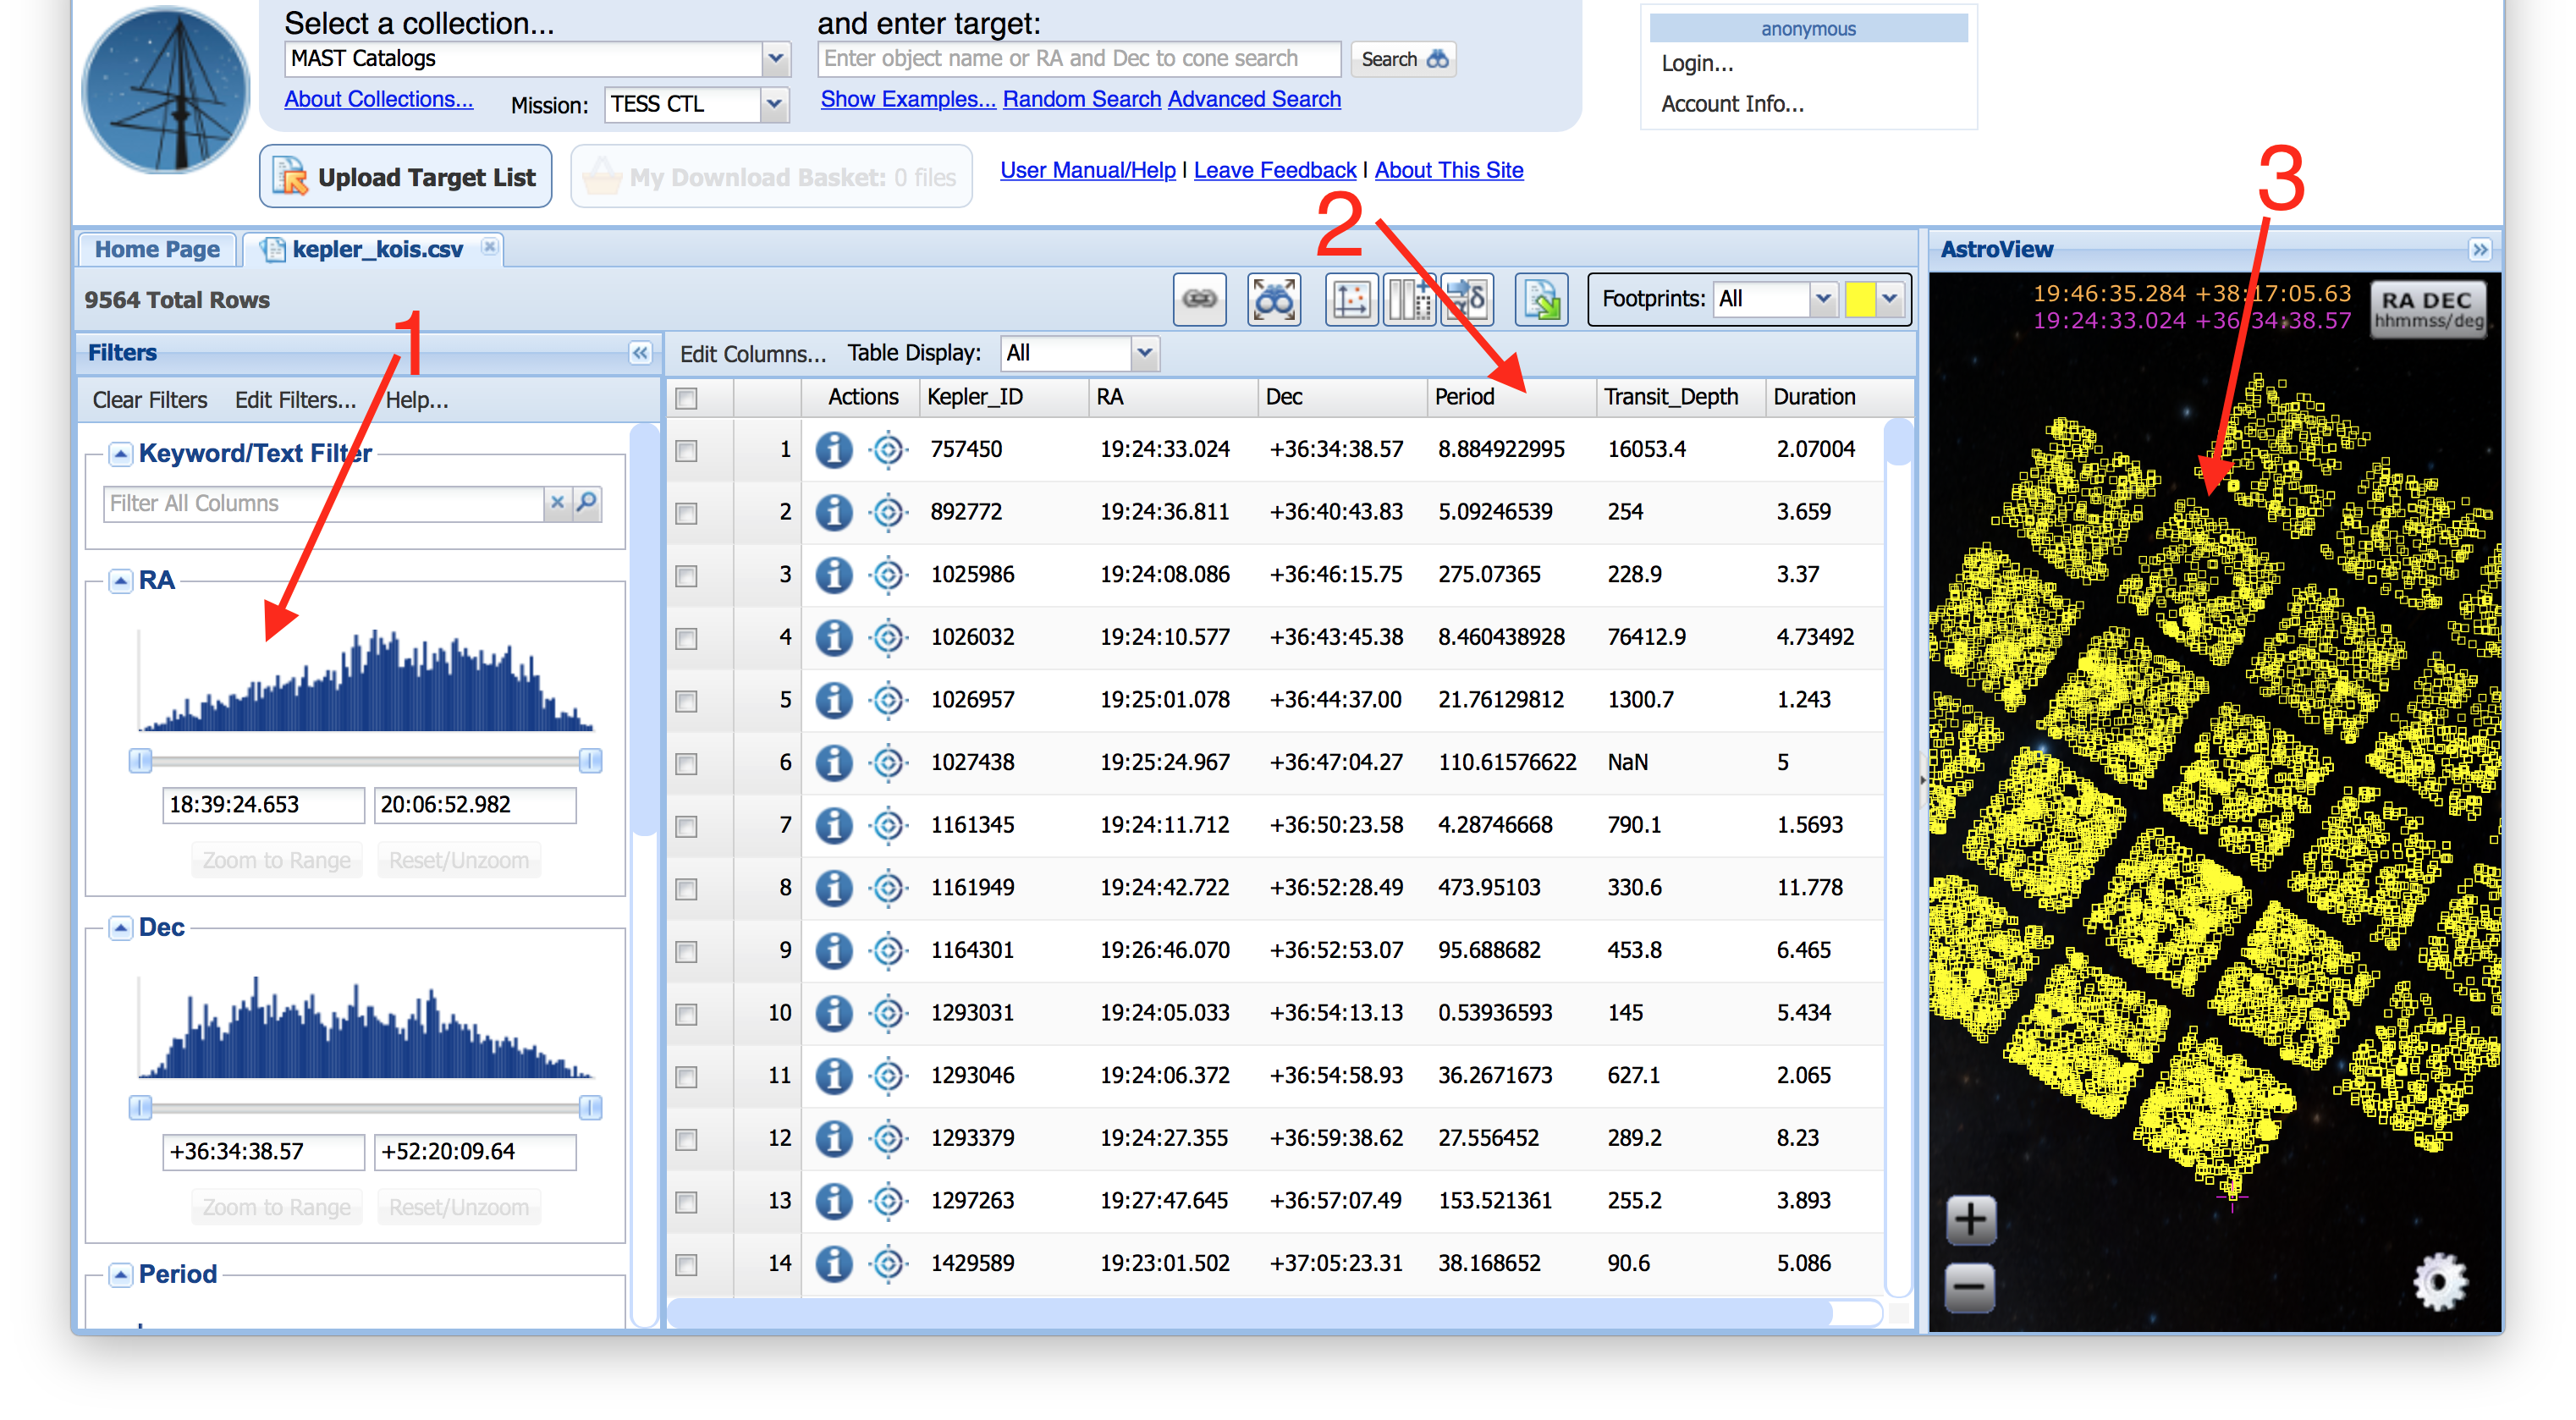
| We now see our target list uploaded into the Portal. There are three main panels in the interface: on the left is the Filters panel (Item #1), where you can select subsets of your uploaded table by filtering column values. In the middle is the Results Grid (Item #2), which contains your uploaded table (hint: columns can be sorted by clicking on the headers). On the right is the AstroViewer (Item #3), which is a 3D sky map that will overplot your uploaded list of targets (if it includes an RA and DEC column), and offers a wide range of background images from surveys that span the electromagnetic sepctrum from X-rays to the radio. We can identify the Kepler footprint on the sky traced by our uploaded list of KOIs. |
 |
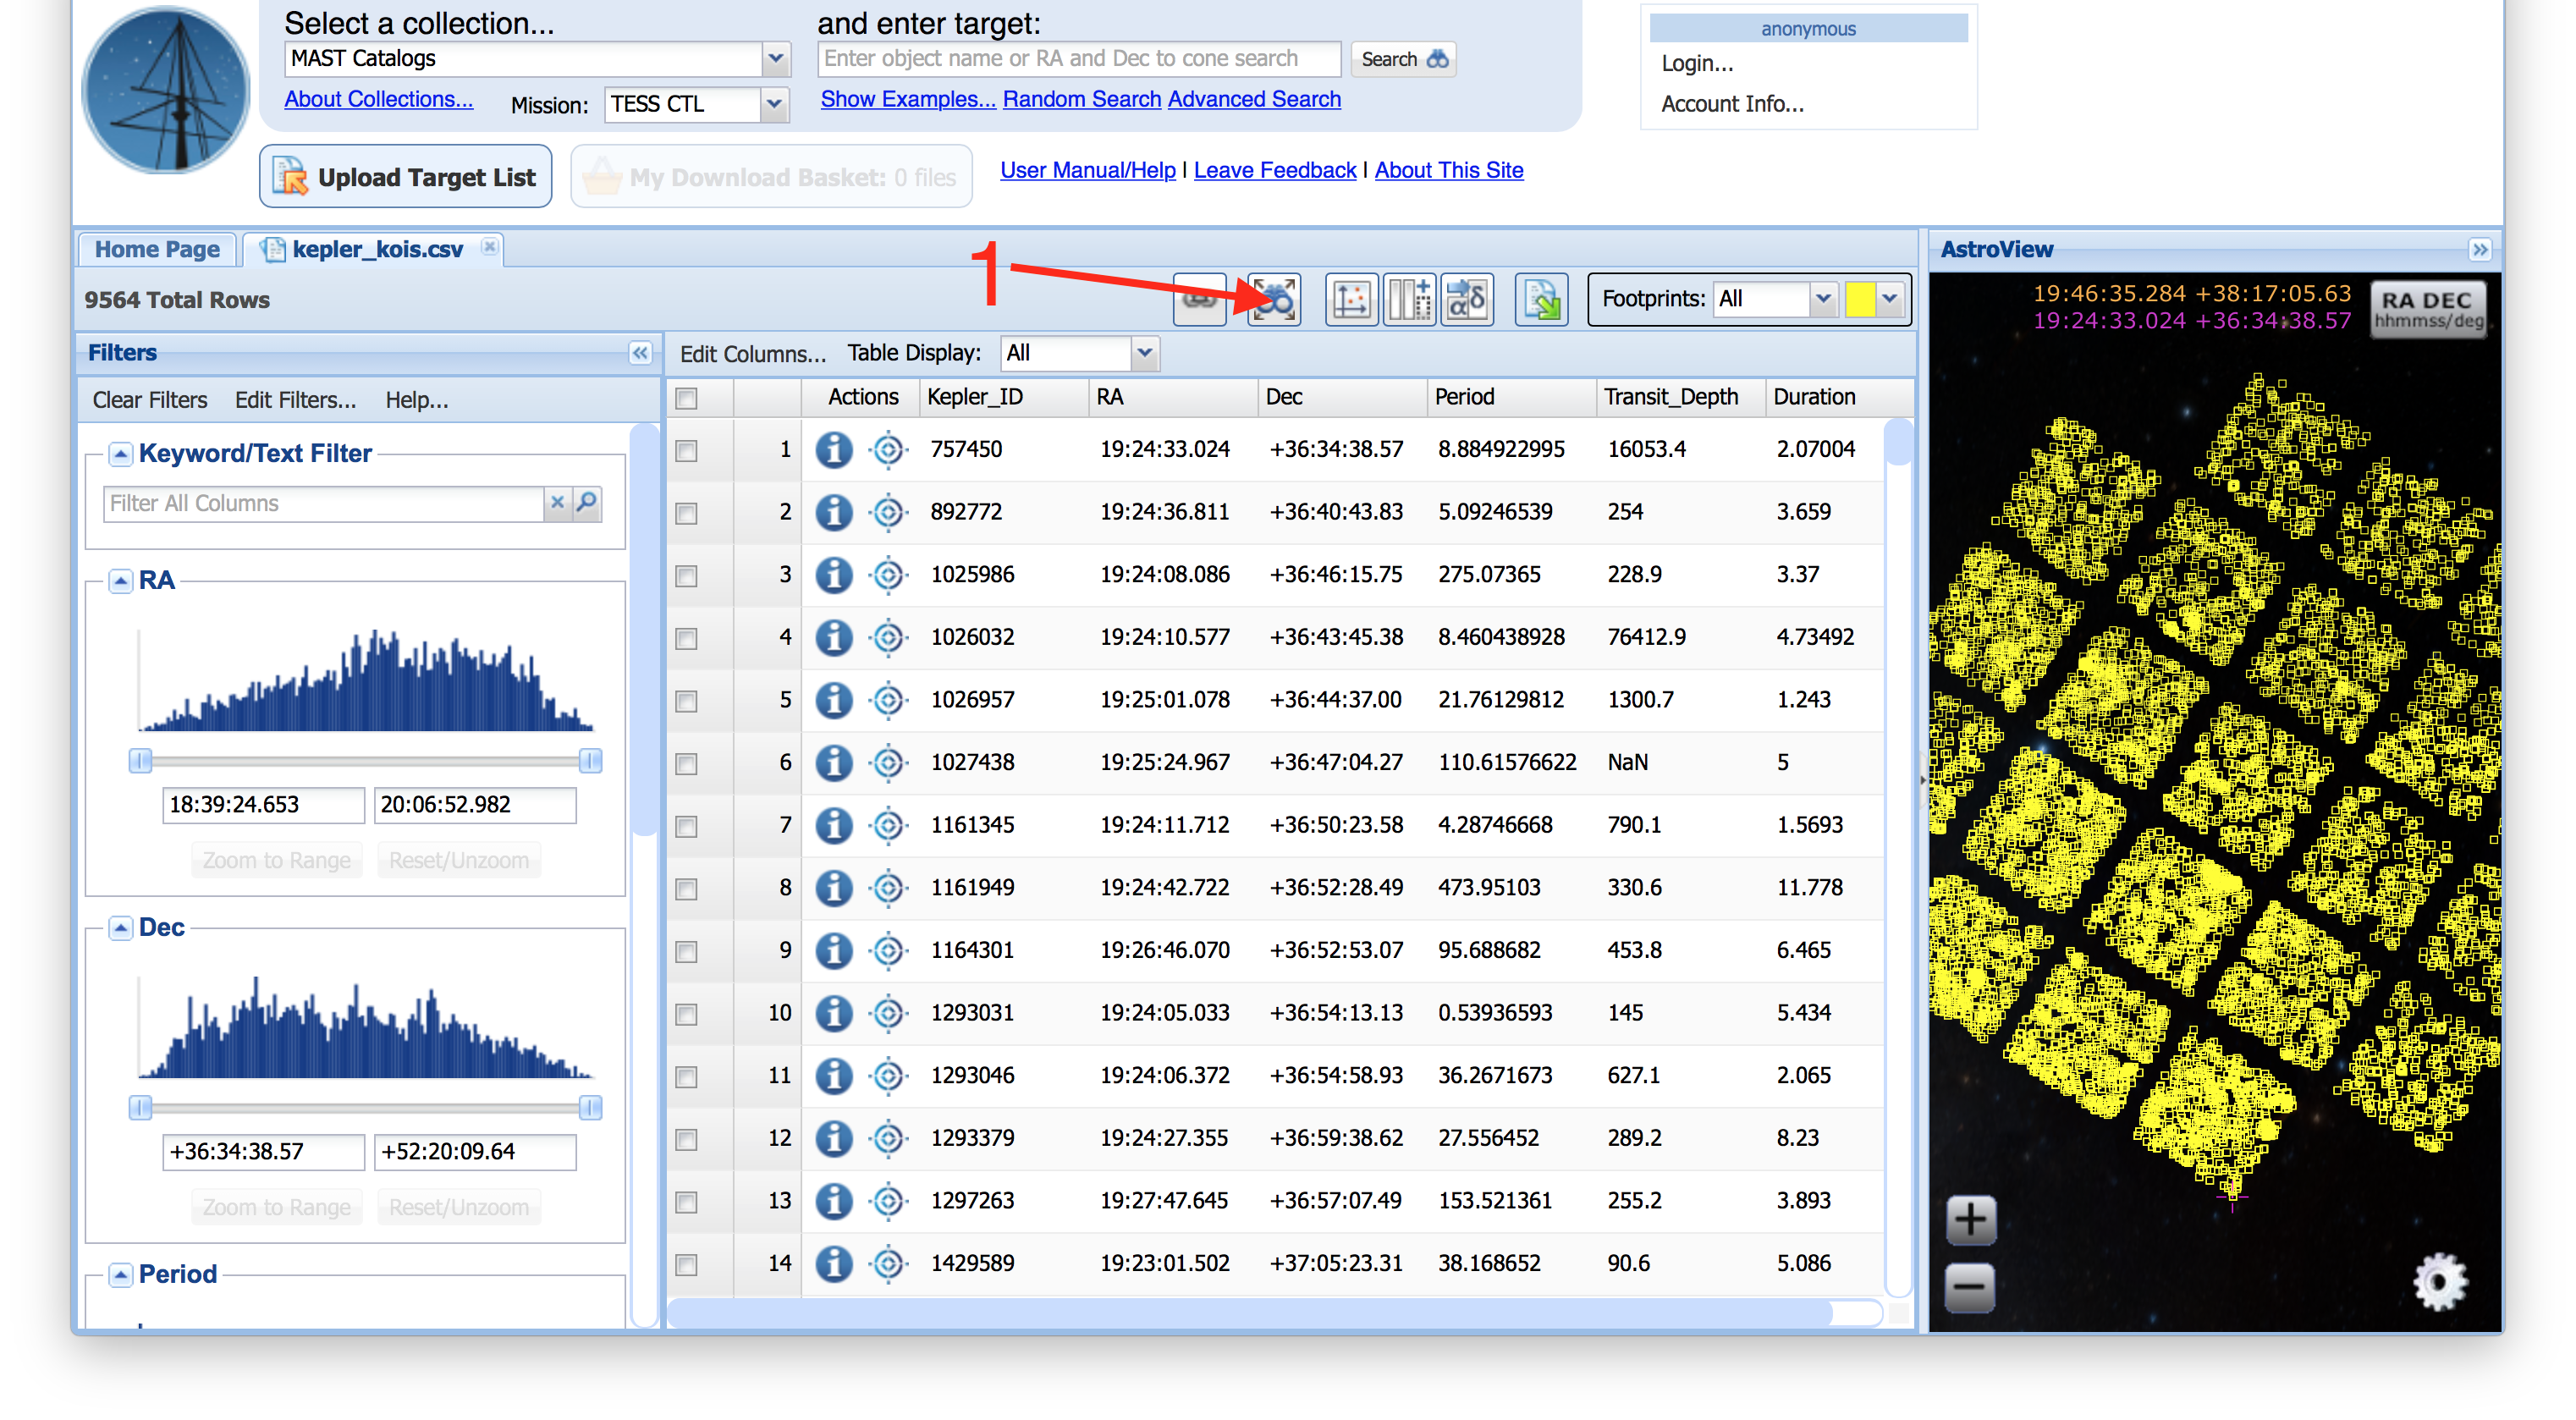
| To find out which of these KOIs correspond to an object in the CTL, we can do a spatial cross-match between our uploaded list of targets and the TESS CTL. To do this, we will make use of the Spatial Cross-Match Button (Item #1). Note: An alternative way to find out this information is to make use of the fact that the TIC includes the Kepler Input Catalog, and thus you can match Kepler KOIs that are in the CTL based on the Kepler ID column in the CTL. Since we are demonstrating how to use the Spatial Cross-Match Tool, we will ignore the fact that Kepler IDs are present in the TIC and CTL. |
 |
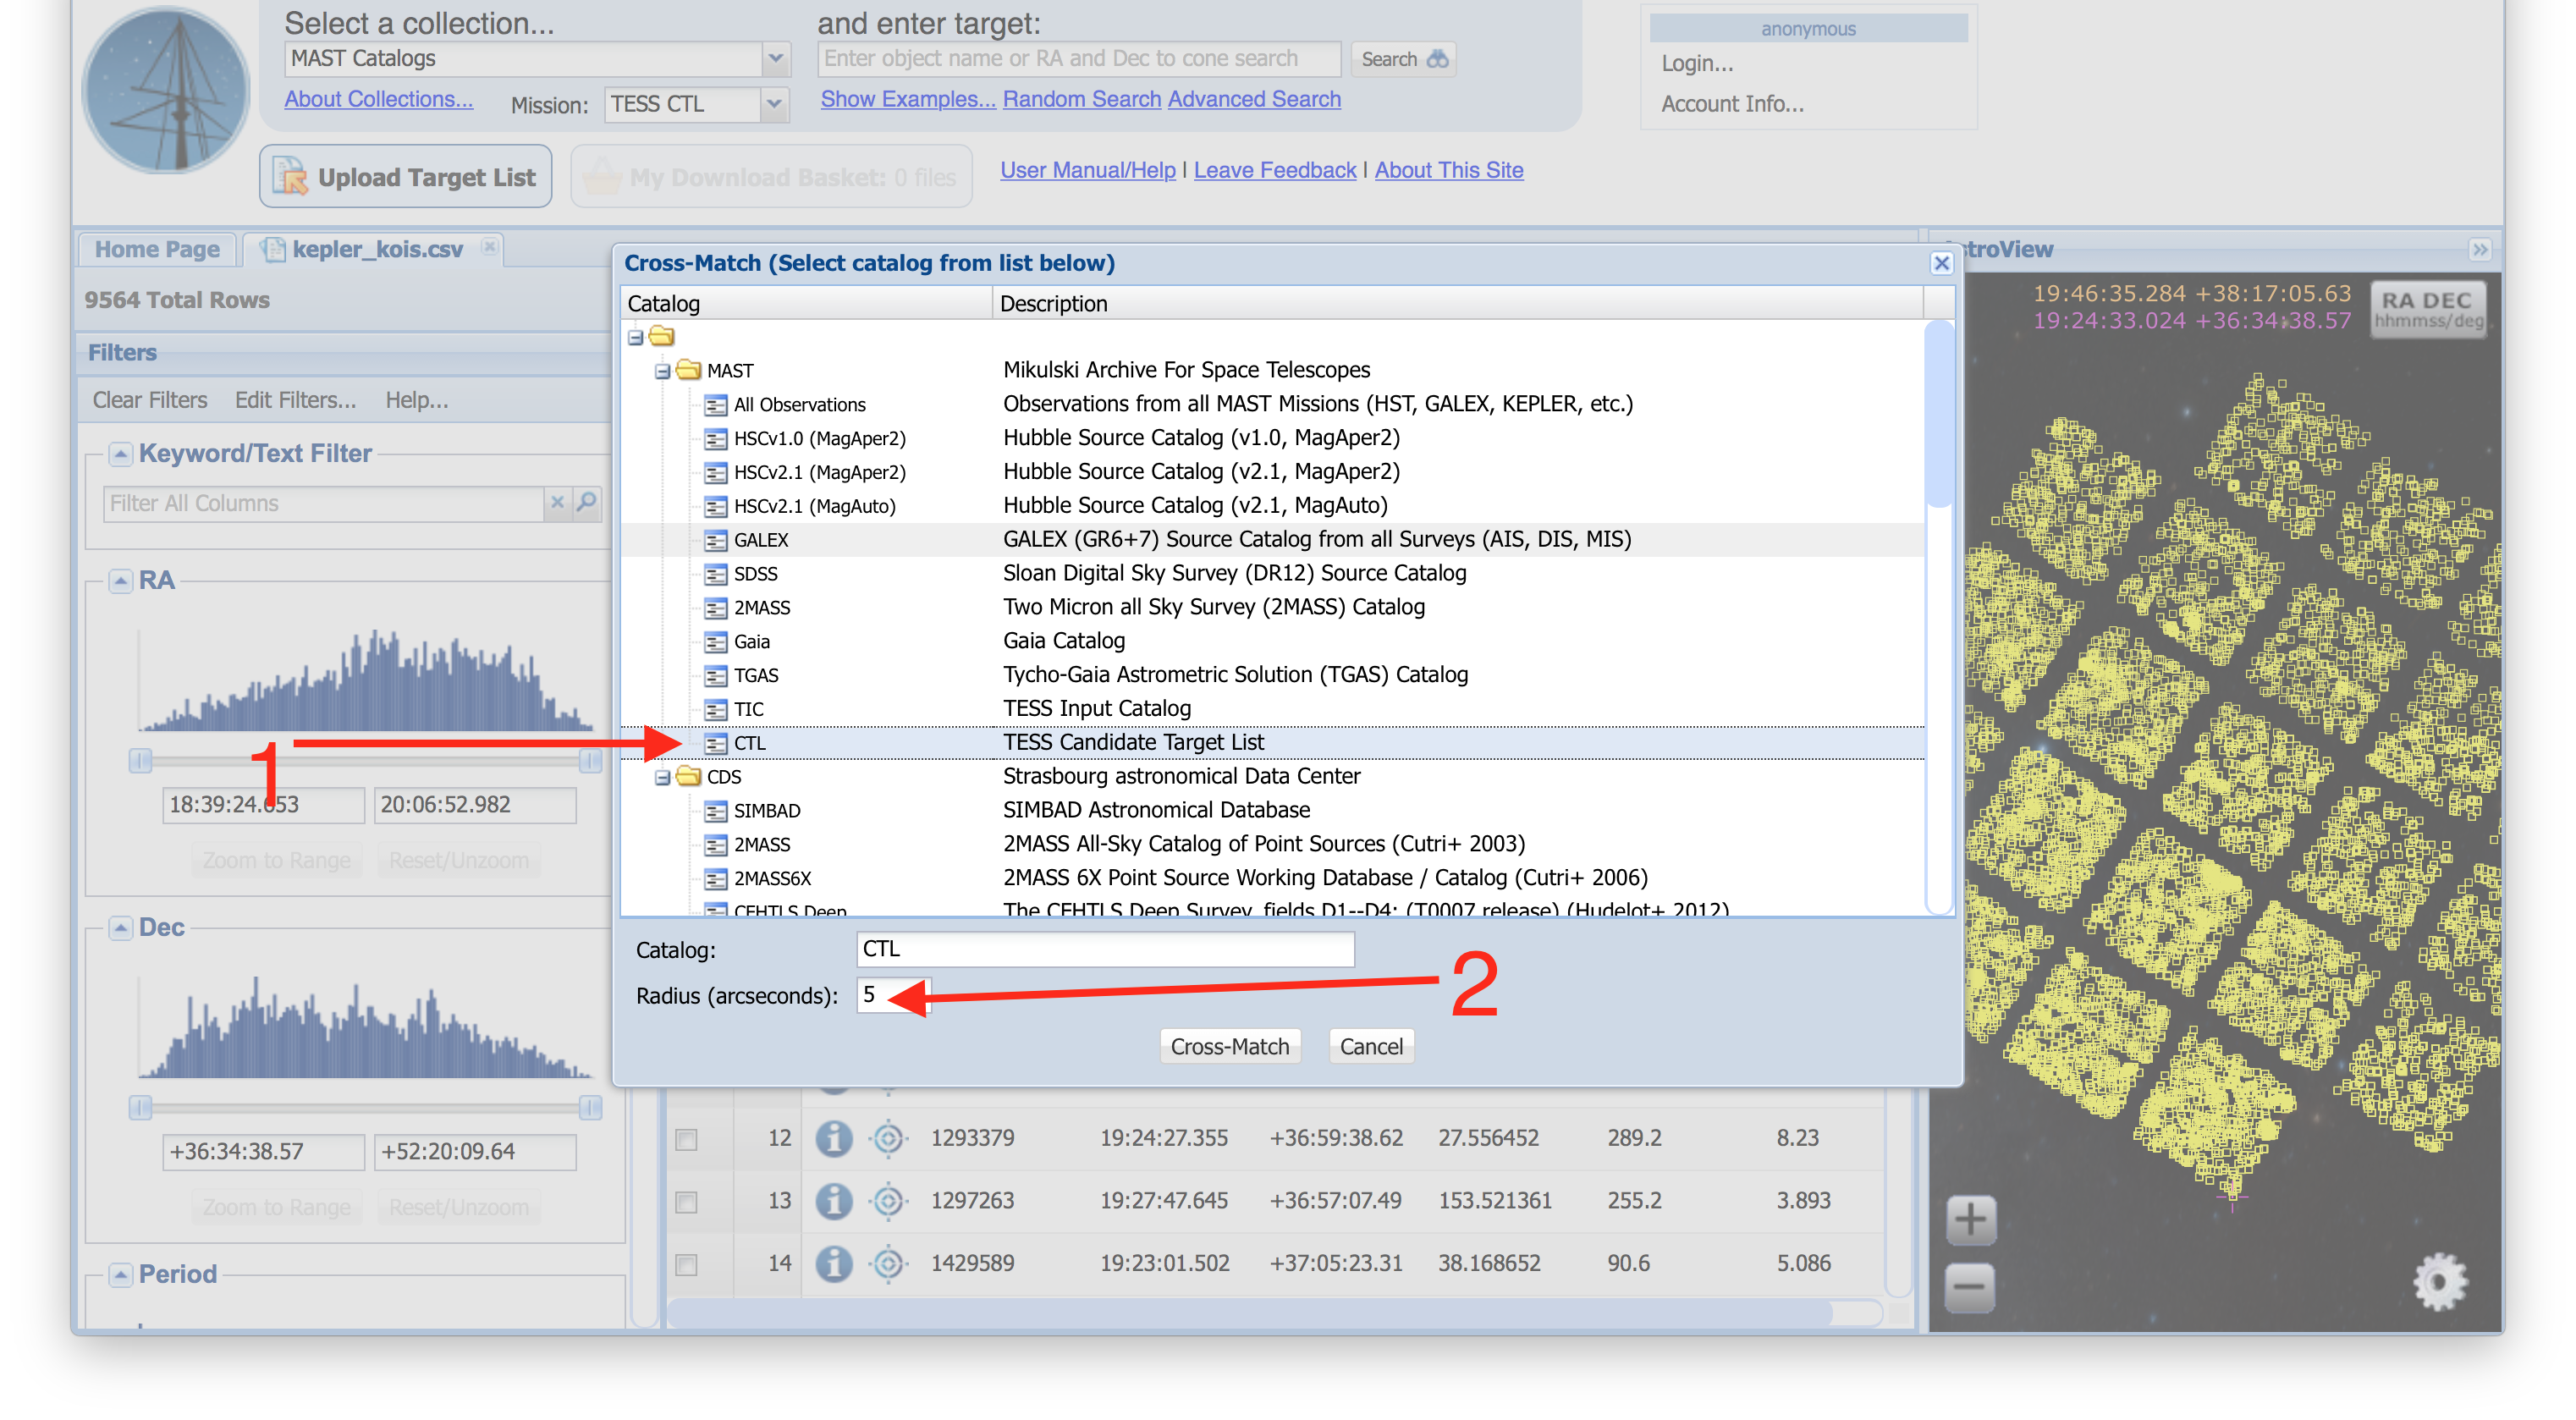
| When the Spatial Cross-Match dialog menu appears, we will select the CTL as the catalog we want to cross-match against (Item #1), though note there are many catalogs to choose from, and more will be added as time goes on. We will also specify the radius to use when doing the cross-matching, in this example, we will consider any CTL object with 5 arcseconds to be a match (Item #2). |
 |
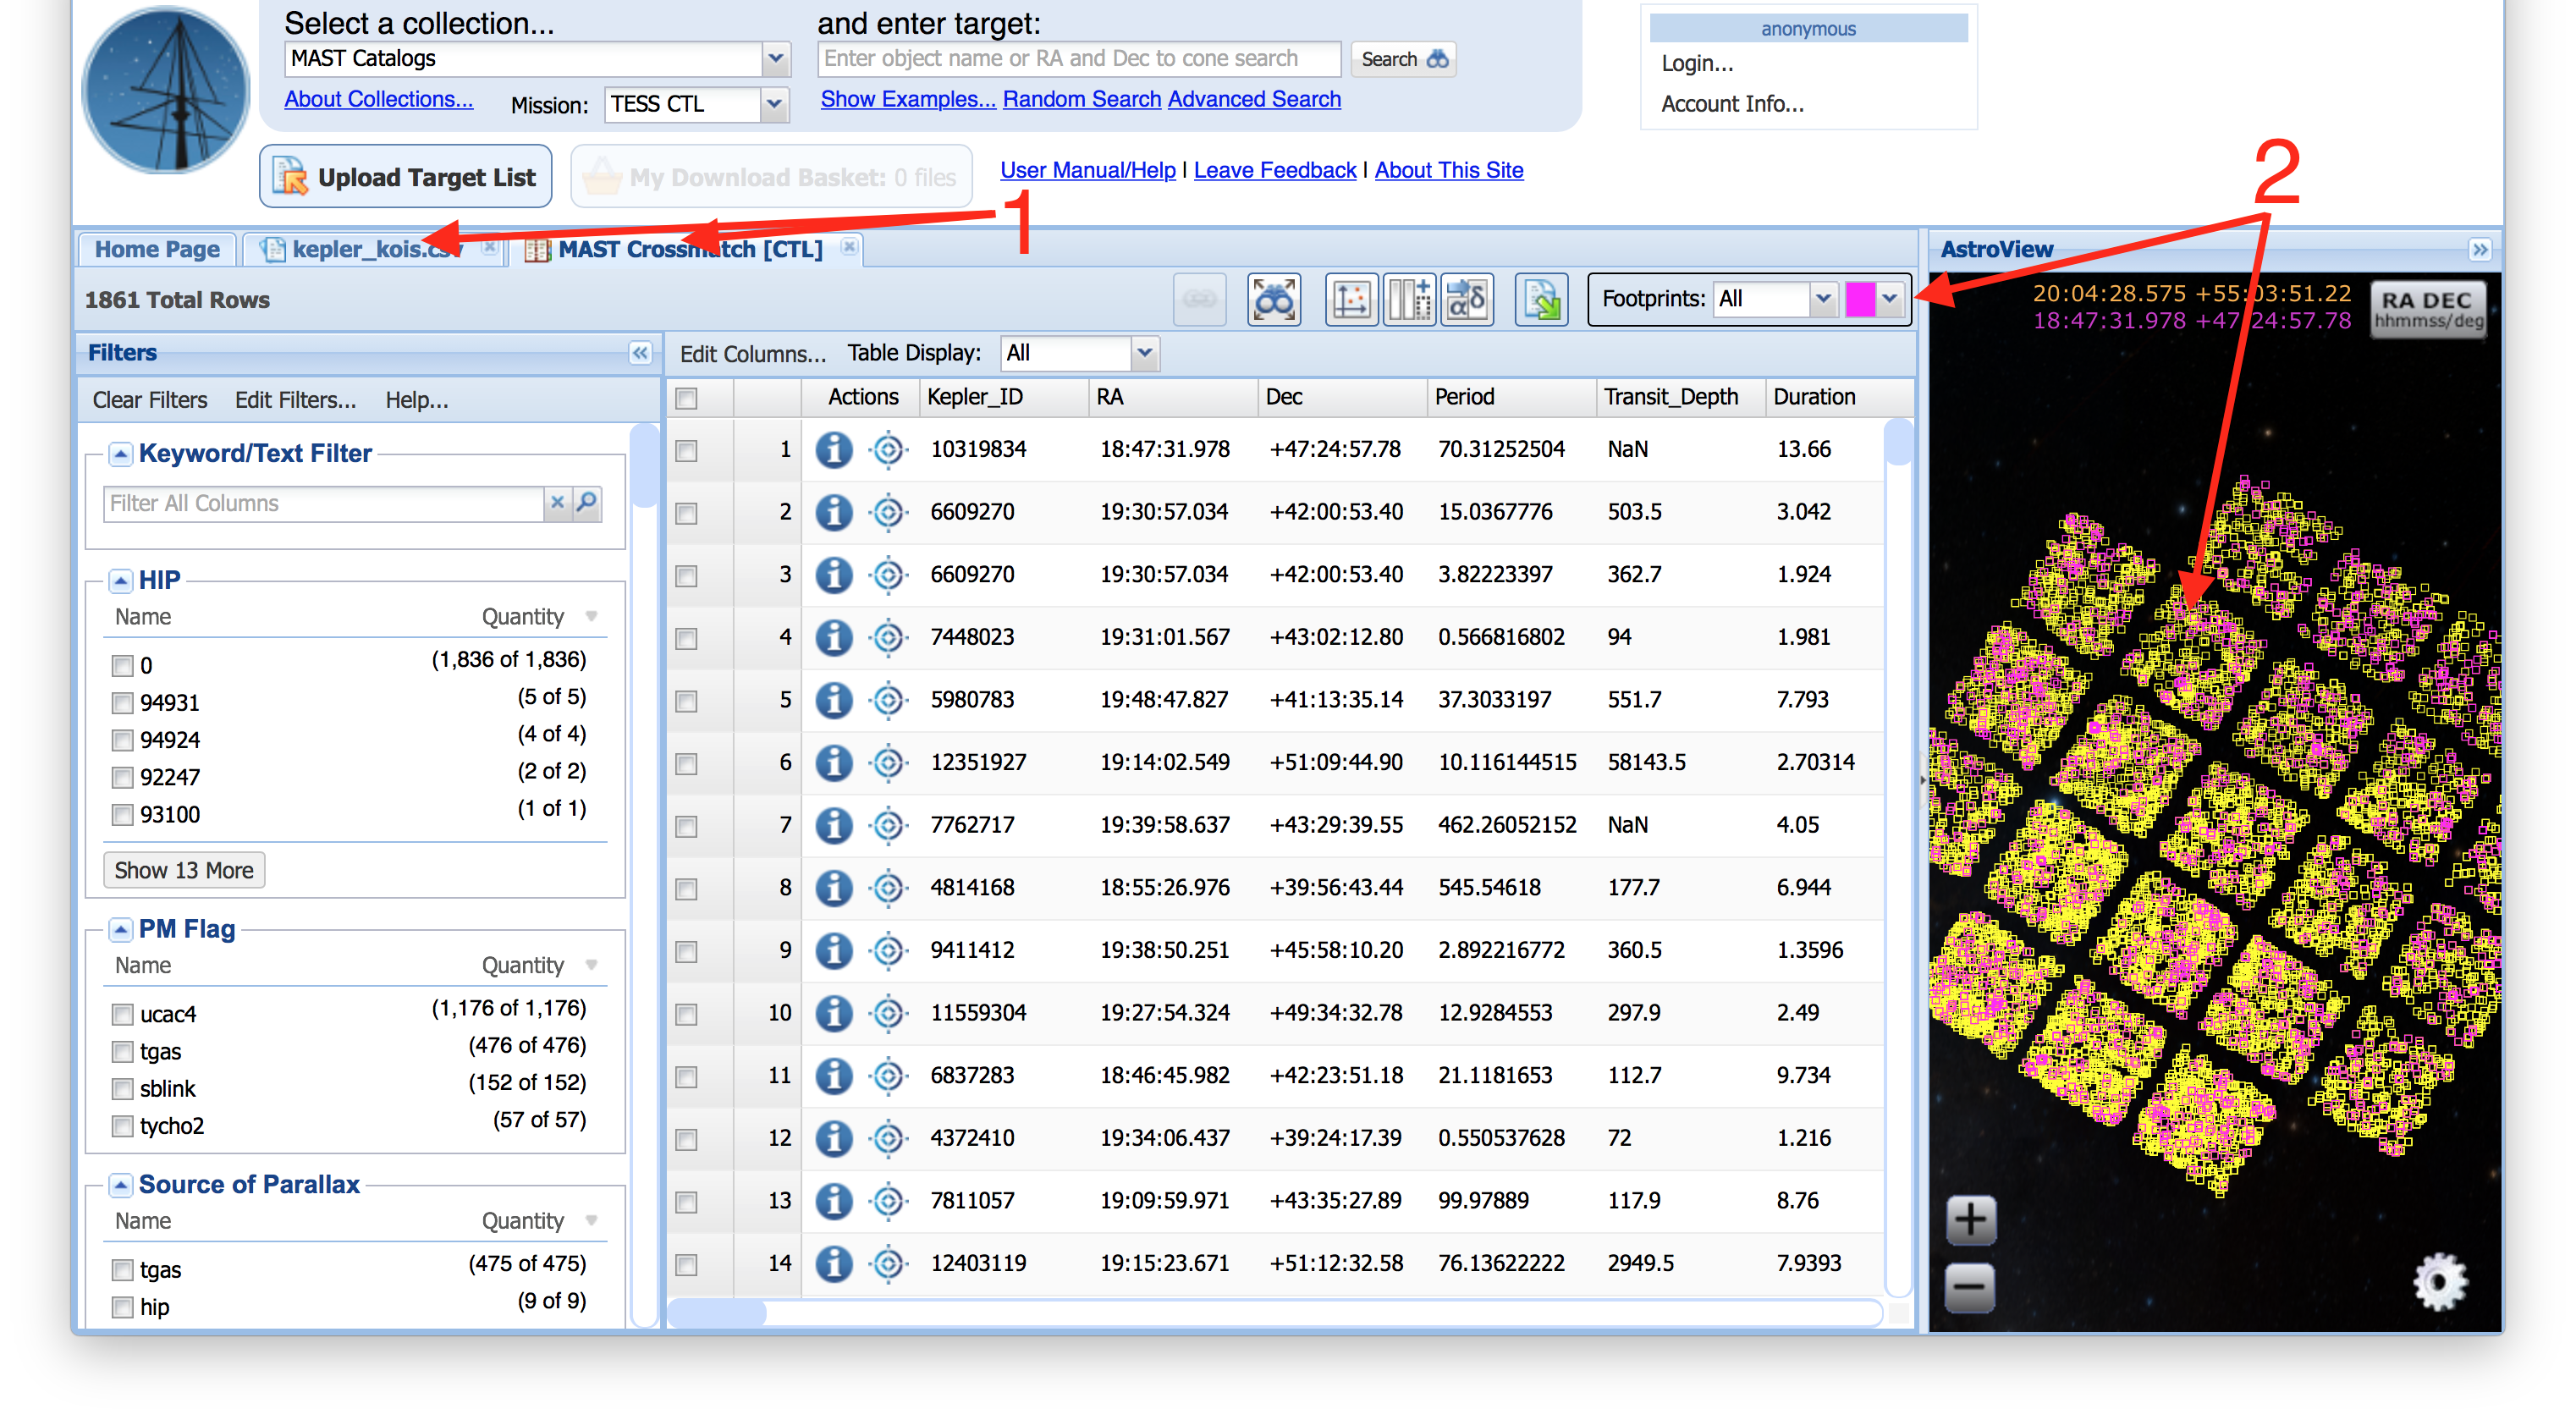
| Whenever you conduct a new search, upload a new target list, or conduct a new spatial cross-match, your results will be stored in tabs, which work like tabs on a web browser. You should see one tab that contains our uploaded list of Kepler KOIs, and another tab that contains our cross-match results (Item #1). By default, the AstroViewer will display the footprints from all tabs (Item #2), which is why we now see both yellow and pink sources in the AstroViewer (in our screenshot, yellow sources are from our uploaded Kepler KOI table, pink come from our cross-match table, and in cases where a source is in both tabs the color that shows up can be random). This can be taken advantage of to create powerful representations of observational footprints on the sky, useful for observing proposals, presentation slides, or even figures in papers, but other times it can be confusing, so let's only display footprints from our cross-match results table. |
 |
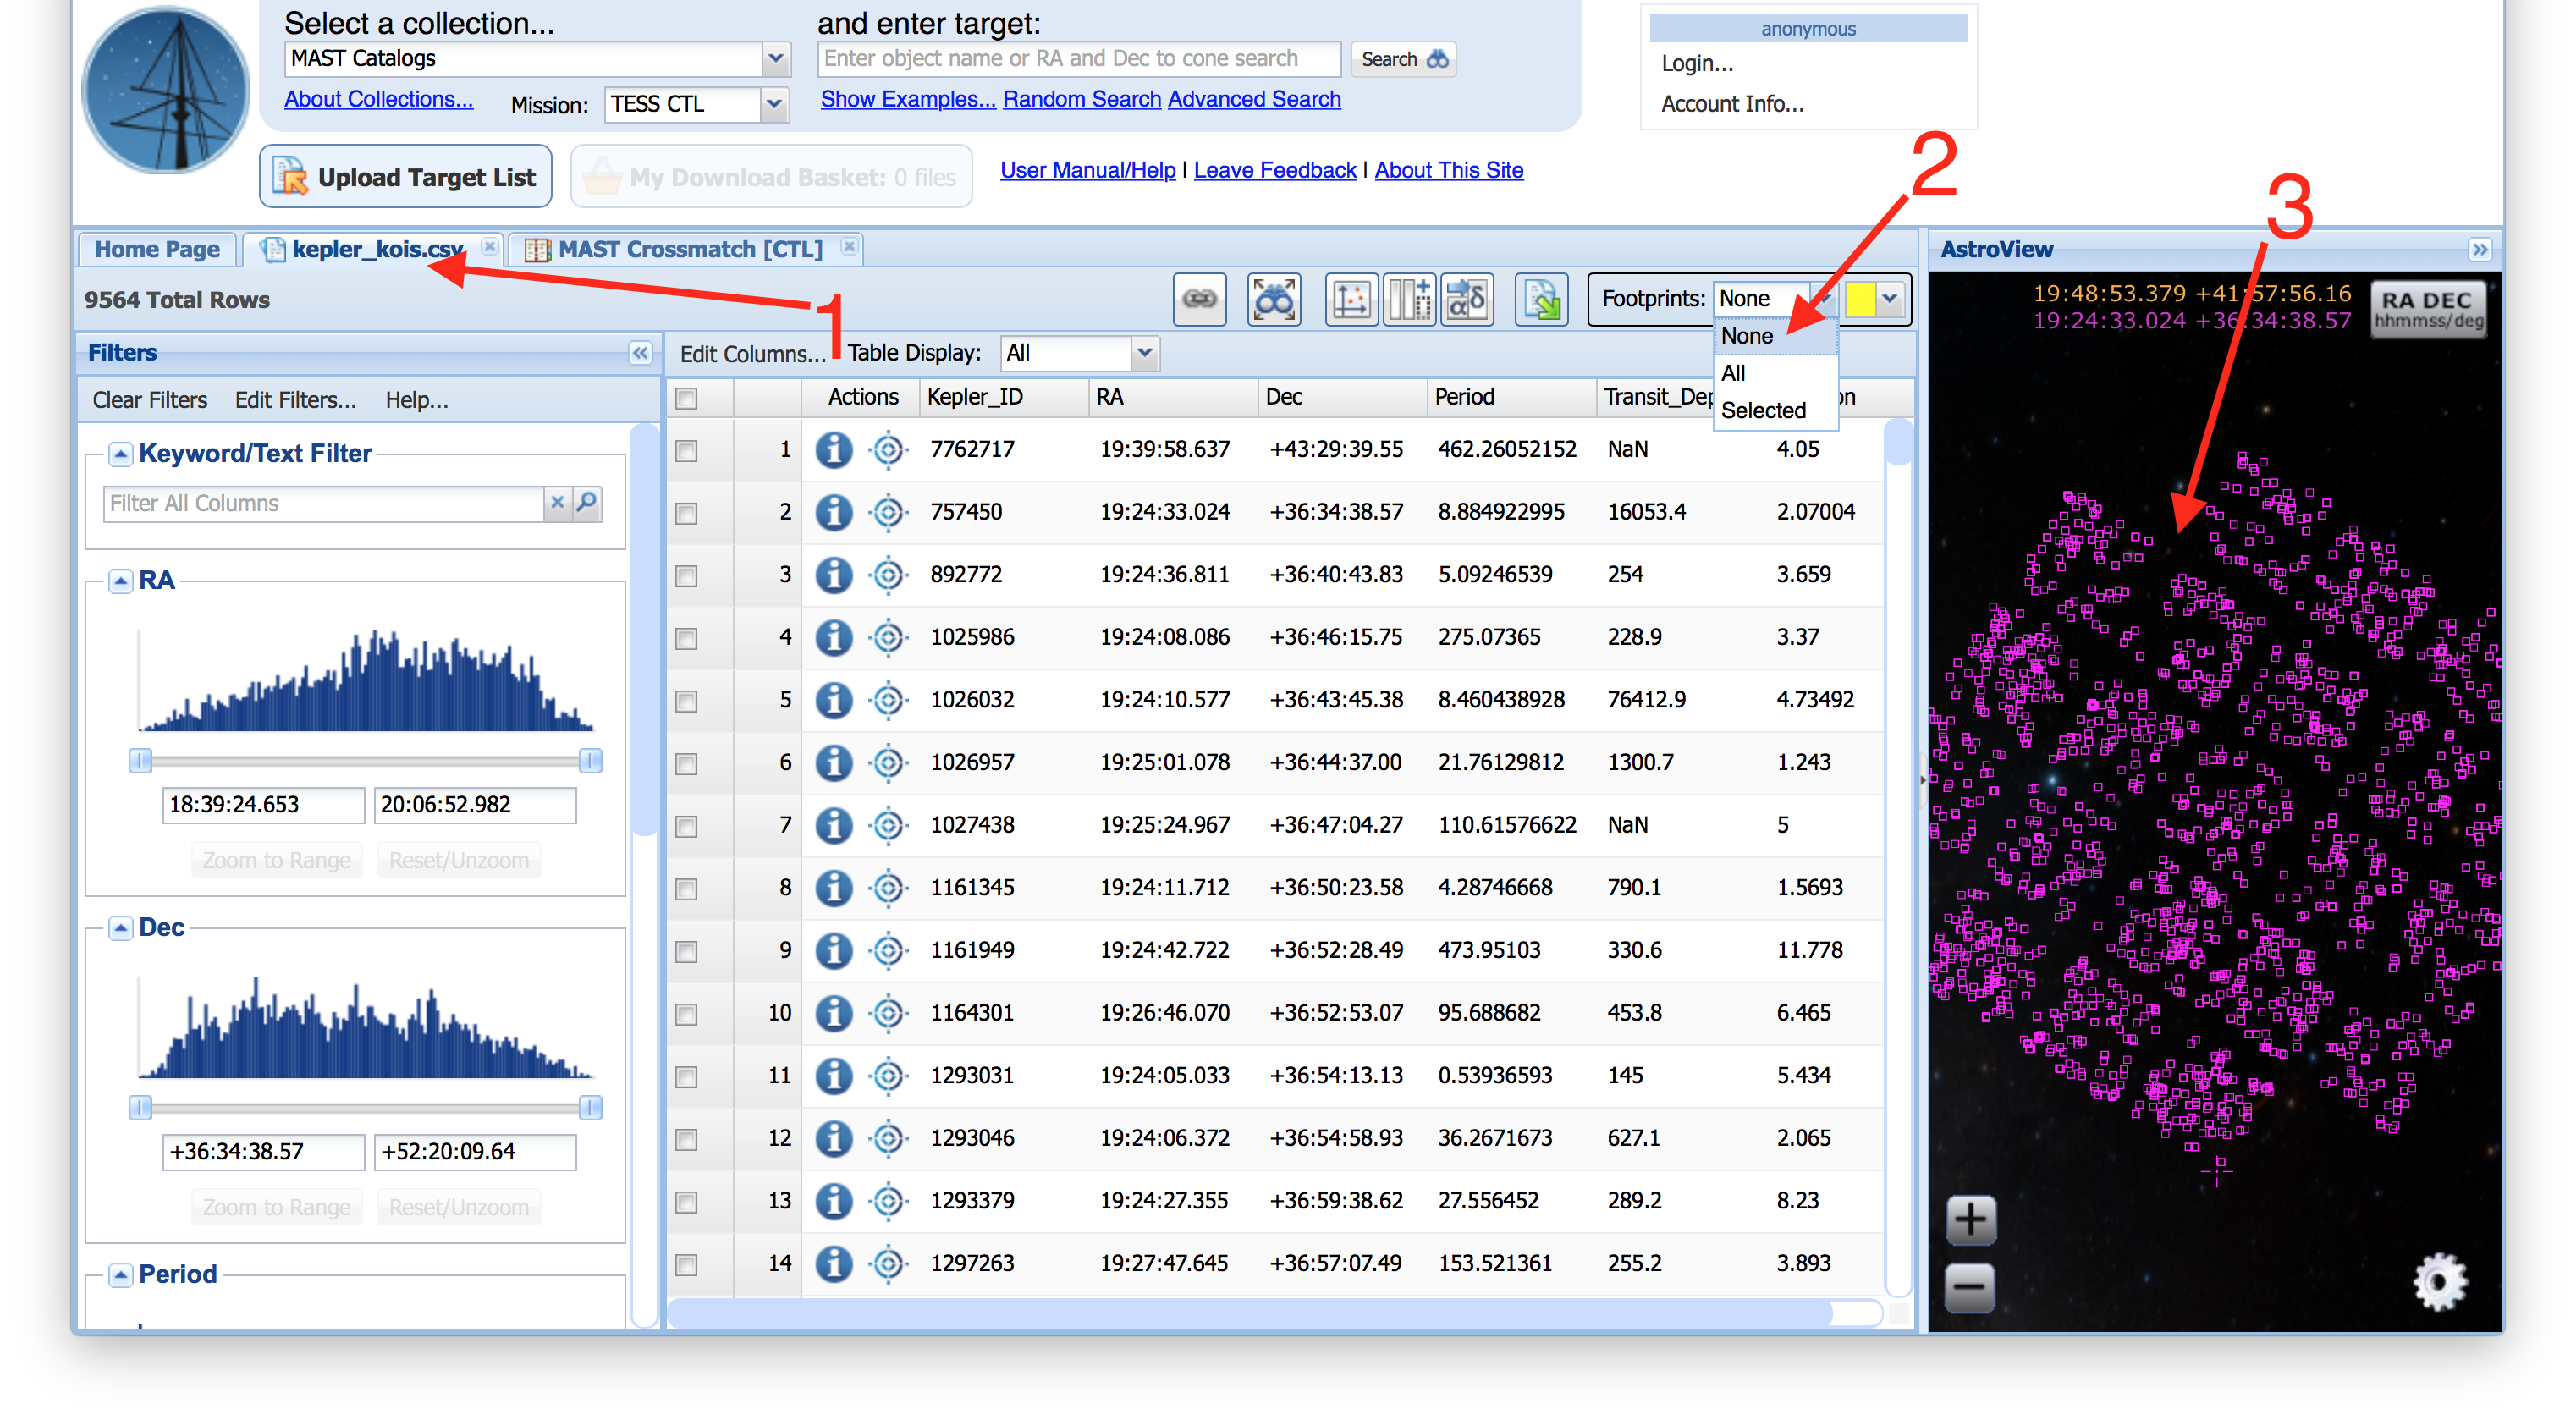
| To display only those sources from our cross-match results table, click on the tab containing our original, uploaded table of Kepler KOIs (Item #1). Next, under the Footprints Display drop-down menu, select None (Item #2). This will hide all the footprints for sources in this tab, and indeed, we can see the AstroViewer now only displays those sources from the table in the cross-match results tab (Item #3). |
 |
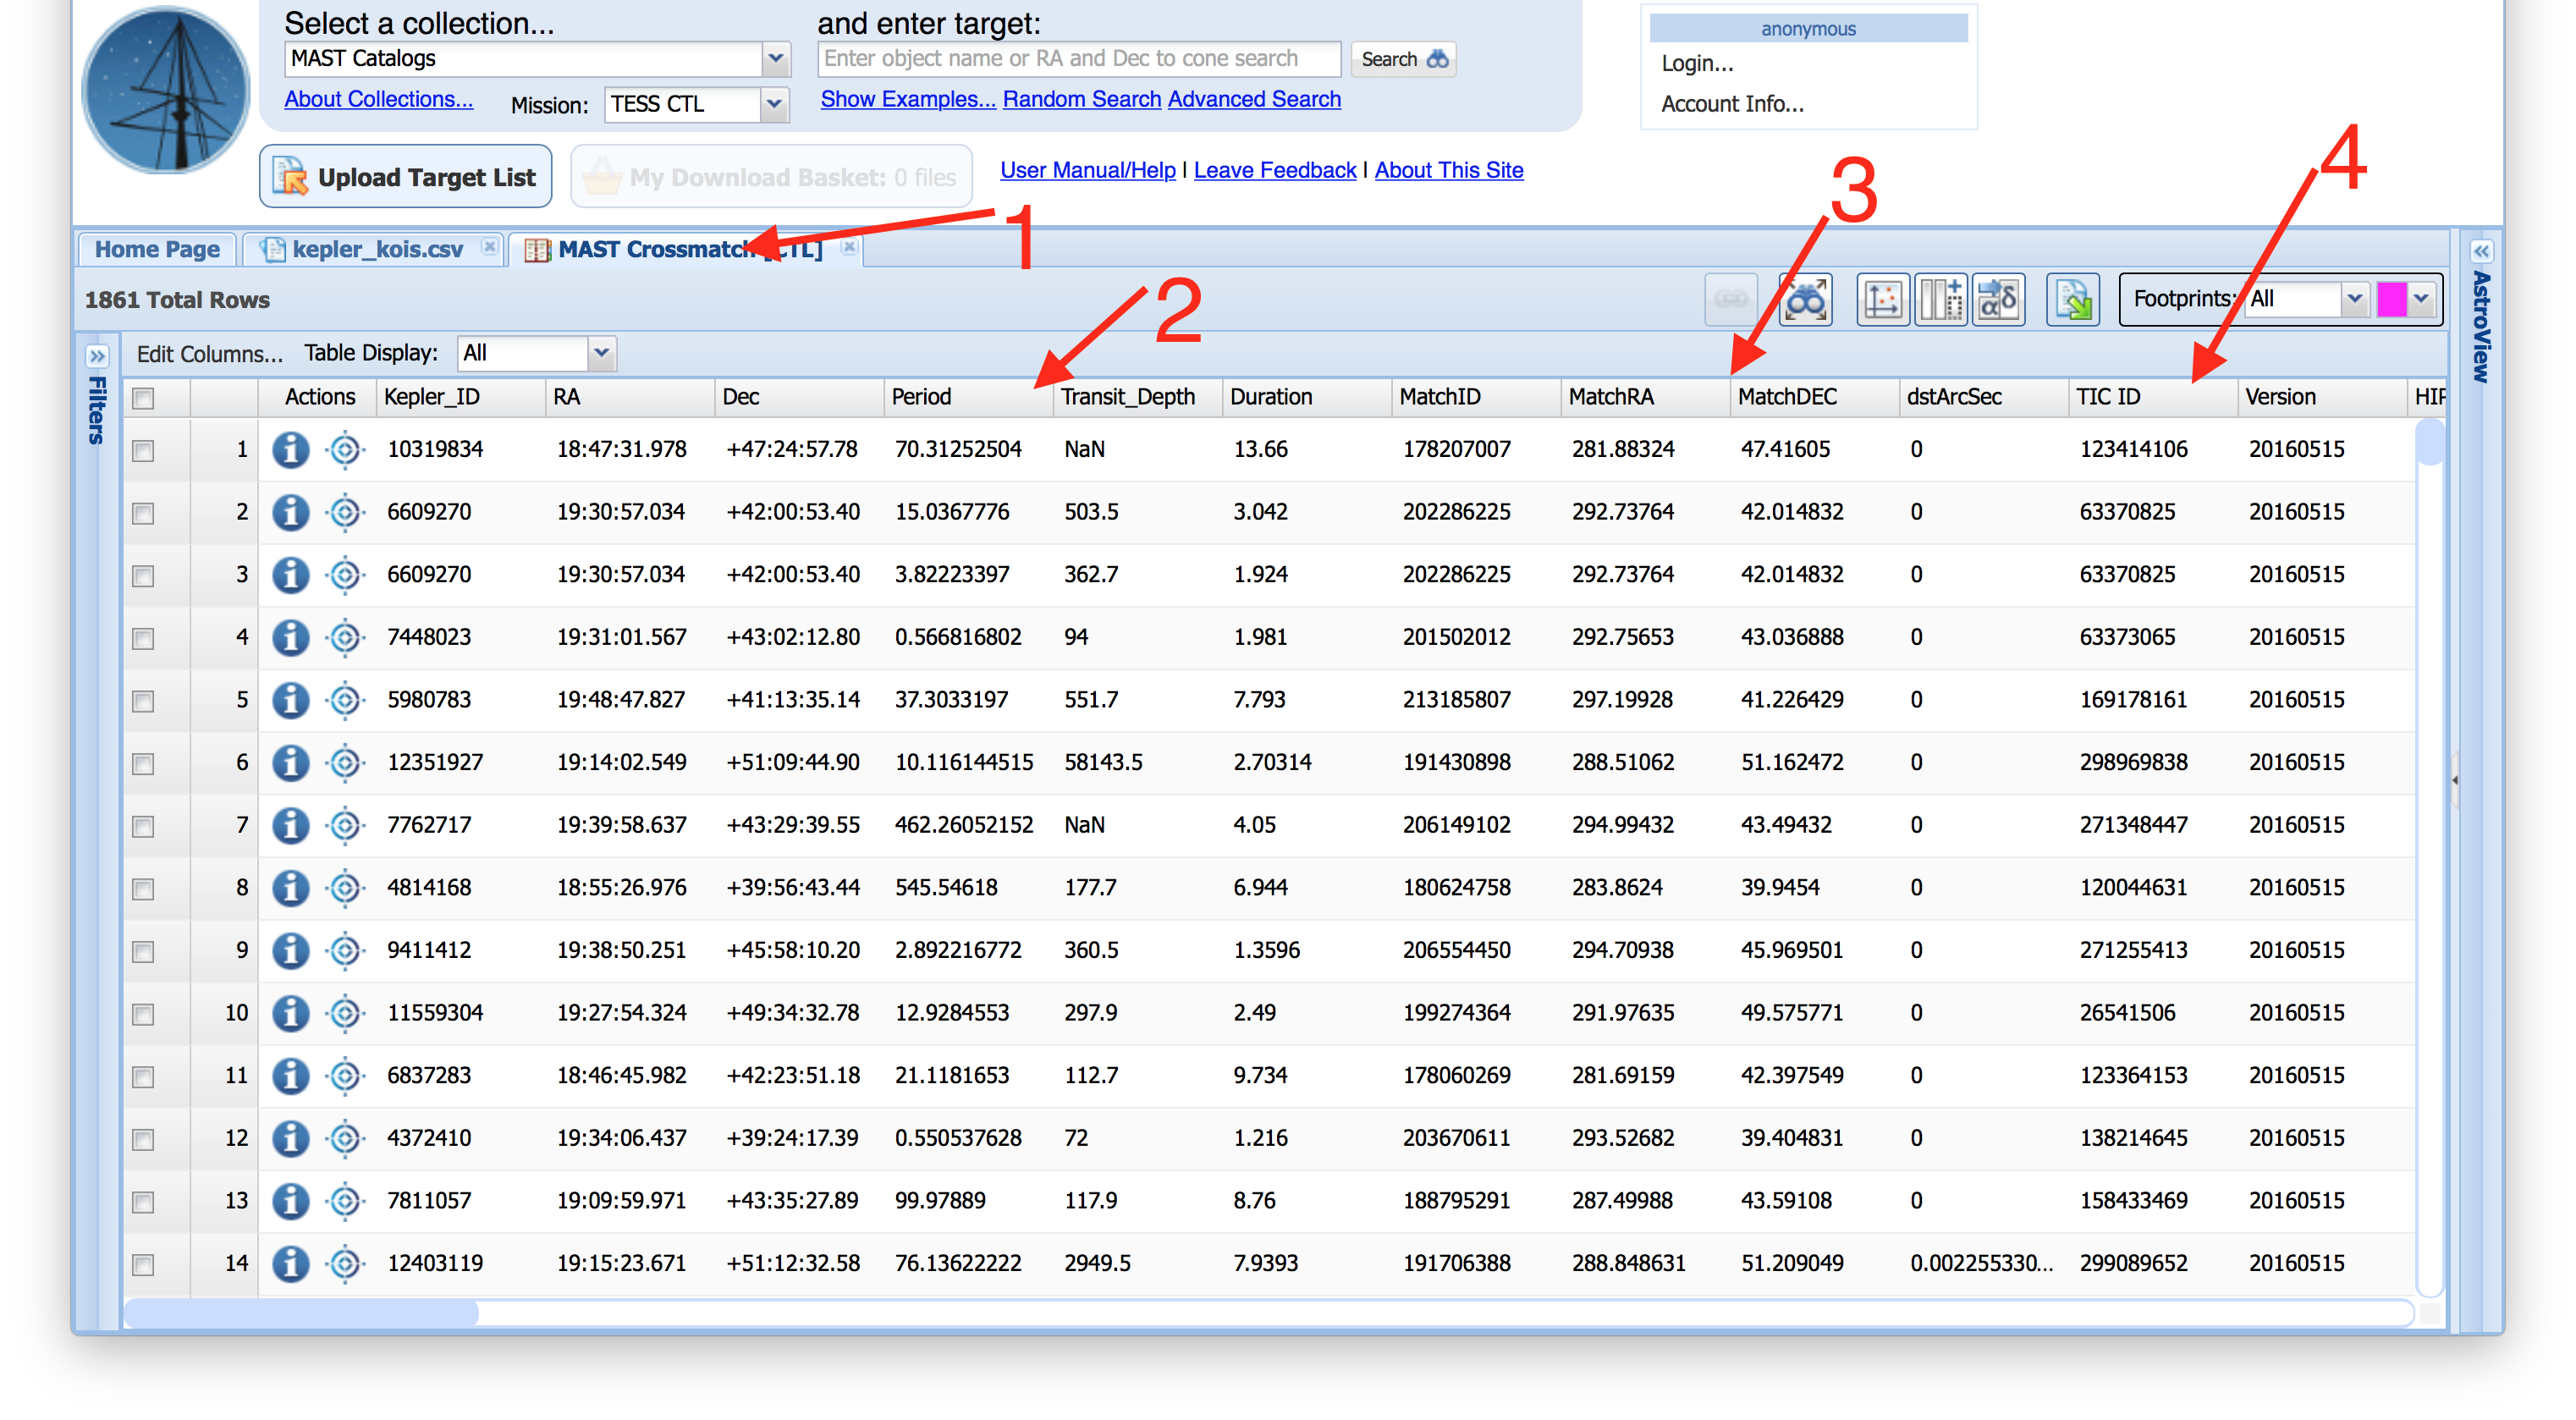
| Let's return to the cross-match results tab (Item #1). We have collapsed the Filters panel and the AstroViewer to display as much of the Results Grid (middle) panel as possible. You can see that our cross-match results table includes all of our original, uploaded columns, including the transit parameters (Item #2), four columns that contain the TESS CTL source ID, RA, DEC, and separation between our uploaded target and the object in the TESS CTL (so-called Match Columns, Item #3), and then all of the columns from the TESS CTL for the matched source (Item #4). We can now export this table and begin doing our analysis using a table that contains both columns from our original table of sources and the TESS CTL. |
 |
|
|
|