|
|||||||||||||||||||
|
|
|||||||||||||||||||
|
|
WAVELENGTH SYSTEMATICS -- Copernicus
Together, Study
2 and Study 3
demonstrate that the wavelength scale of NEWSIPS differs from
those of IUESIPS & Copernicus by amounts which contain not only an offset
but a wavelength dependence which can attain a few km/s.
We now show reasons why these differences may
arise from a subtle, systematic variation of laboratory wavelengths with
wavelength.

|
| Figure A |
|---|
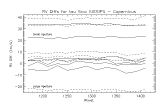
Figure A is a superposition of the white dwarf and Tau Sco results (star and diamond symbols, resp.) from Fig. 2 with apparent "velocity" errors obtained from old and new wavelengths for PtNe lines used in common to calibrate the IUESIPS and NEWSIPS wavelengths. The PtNe differences are shown as a solid line. Note the general agreement of solid line with the systematics of the white dwarf/tau Sco measurements. This agreement suggests that the trends shown lie in laboratory wavelengths and not in calibration errors in either the IUESIPS or NEWSIPS *short wavelength* (SWP) systems.
The IUESIPS and NEWSIPS wavelengths were measured from a PtNe emission line source on board the IUE satellite. Laboratory wavelengths used in these analyses were taken from laboratory studies using equipment and techniques contemporaneous to two different eras. The wavelengths used in the IUESIPS (see IUE Newsletter No. 13 of January, 1981) are taken from a set of (ranked) references in the older literature, while the NEWSIPS wavelengths were obtained from a NIST study commissioned by the HST Project, namely Sansonetti et al. (Reader et al., ApJ Suppl., 72, 831, 1990).
Rogerson and Upson (ApJ, 35, 37, 1977) state that the initial wavelengths in the Copernicus U1-spectrograph predicted from geometric optical principles system showed small systematics from the then-current laboratory wavelengths for Fe and Ne used for this calibration which were similar to the reflex of the errors shown above. The distribution of errors from ~1100 Å to 1700 Å shows a quadratic dependence in wavelength. The Copernicus system was adjusted to fit these laboratory wavelengths. Subsequently, D. Morton compared wavelengths for interstellar features in Copernicus spectra with wavelengths expected for these clouds from optical measures which had established their radial velocities. He found systematic errors between velocities from the Copernicus system, adjusted for the 1970's lab wavelengths, and those inferred from measurements of optical lines assumed to originate in the ISM clouds which produce the UV absorption lines (ApJ, 197, 85, Figs. 3 & 4; ApJ, 222, 863, 1978, Figs. 2 & 3). These systematics included a linear drift over the Copernicus "U1" (<1500 Angstroms) range and a quadratic dependence over its "V1" range (>1600 Angstroms).
Thus, the systematic in equivalent radial velocity can be understood
if the pre-1990 system of UV laboratory wavelengths for a variety of ions
suffers wavelength dependent errors of up to several km/s. By this explanation
the Copernicus and IUESIPS systems would be similarly affected and consistent
with Morton's findings.
SHORT WAVELENGTH SYSTEMATICS -- Orfeus
If the above conclusions are correct there should be no wavelength-dependence
in the velocity differences between two systems which are both calibrated
from recent laboratory wavelengths. This expectation is validated in Figure B,
which shows a
| Figure B | |
SHORT WAVELENGTH SYSTEMATICS -- GHRS
| Figure C | |
as well as laboratory wavelengths. The dots in Figure C exhibit the individual equivalent velocity errors (again, observed minus lab) for 728 photospheric lines in the range 1190 -- 1775 Å. Running median averages of every 9th and 10th point are shown by the lines. These lines show "dips" (positive "RV" excursions) in wavelength ranges 1200 -- 1230 Å, 1400 -- 1580 Å and above 1700 Å. The first of these dips is consistent with the minimum (in the reversed sense plotted) near 1200 Å in Figure 2. Simulations of random numbers generated with the similar error distributions to that shown in Fig. C show excursions in running median averages which are less half of those observed in this figure. We take these last two points to be consistent with the short-wavelength systematics of a few km/s discussed above and that they also extend to longer wavelengths.
LONG WAVELENGTH SYSTEMATICS -- GHRS
| Figure D | |
grating. as well as laboratory wavelengths. The dots in Figure C exhibit the individual equivalent velocity errors (again, observed minus lab) for 394 photospheric lines in the range 1190 -- 1775 Å. The solid line gives a running 30-point average of these differences. Note that the ISM molecular OH lines (starred symbols) and Fe II lines designated as "Kurucz" by squares seem to shared the trend shown by the photospheric lines. The agreement for each of these sets of lines suggests, this time, that it is not the laboratory line wavelengths which are in error but rather the measured wavelengths or the GHRS wavelength calibration of this grating.
|
|
|


 Follow Us