


 Follow Us
Hyperspectral Images of Uranus with STIS (Uranus-STIS)
Karkoschka & Tomasko (2009), Sromovsky et al. (2014), Sromovsky et al. (2018)Introduction |
Description of Data Products |
Data Access |
README |
Introduction
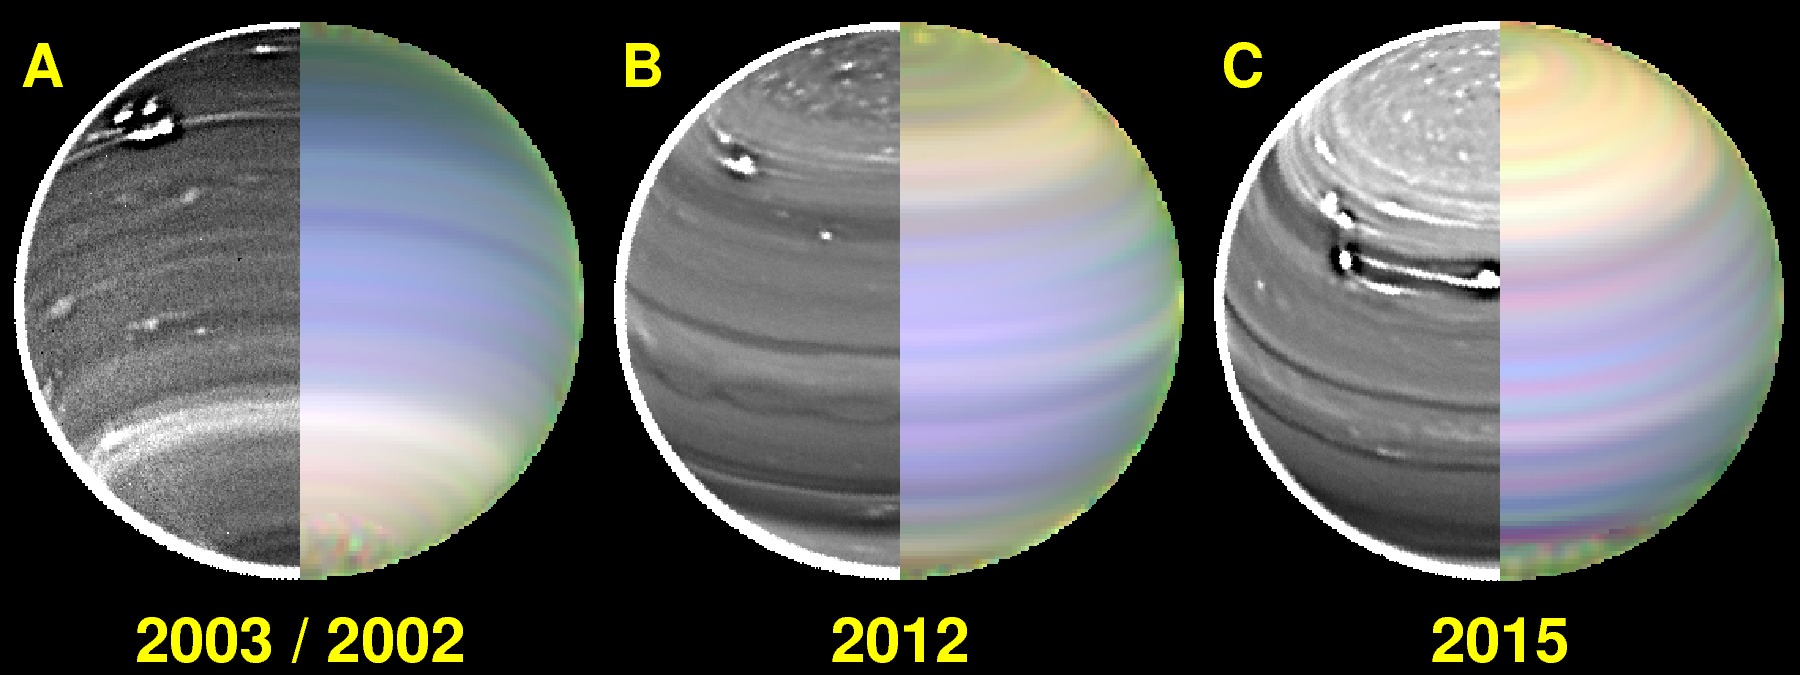 Fig. 11 from Sromovsky et al. (2018) showing composite images of the disk of Uranus for 2002 (A: left), 2012 (B: middle), and 2015 (C: right). The right half of each image is a color composite of fitted center-to-limb smoothed images, using the color assignments R=930 nm (methane), G=834.6 nm (methane + hydrogen), and B=826.8 nm (mostly hydrogen). The left half shows shows rotation-corrected H-band images from the
NIRC-2 instrument on the
Keck-II telescope.
Fig. 11 from Sromovsky et al. (2018) showing composite images of the disk of Uranus for 2002 (A: left), 2012 (B: middle), and 2015 (C: right). The right half of each image is a color composite of fitted center-to-limb smoothed images, using the color assignments R=930 nm (methane), G=834.6 nm (methane + hydrogen), and B=826.8 nm (mostly hydrogen). The left half shows shows rotation-corrected H-band images from the
NIRC-2 instrument on the
Keck-II telescope.
The data provided in this collection were obtained with the STIS 0.10" long-slit, which was aligned with the planet's polar axis and stepped across the disk at intervals of 0.152" from center to edge. This observing pattern was executed for both the G430L and G750L gratings. The data were pipeline processed, extracted, calibrated, and combined (see Sromovsky et al. 2018 and references therein), with the uniform spatial and spectral sampling noted above. Note that Uranus rotated more than 45° during the course of the observations, so any analysis of these data would have to presume a high degree of zonal symmetry.
Description of Data Products
Each of the three hyperspectral cubes are stored in multi-extension FITS files. Hyperspectral cubes have two spatial and one dispersion dimension. The spatial longitude and latitude dimensions are all 75×150 pixels, respectively; the spectral dimension (extensions 1 and 2) is 1800 pixels. The image extensions correspond to various quantities, all but the first of which contain coordinate information, as described in Table 1 below.
| Extension Name | Dimensions | Content |
|---|---|---|
| SCI | 75×150×1800 | Calibrated spectral radiance in dimensionless I/F |
| WAVELENGTH | 1800 | Spectral dispersion coordinate (nm) |
| LAT_CENTRIC | 75×150 | Planetocentric latitude (deg) |
| LAT_GRAPHIC | 75×150 | Planetographic latitude (deg) |
| REL_LON_EAST | 75×150 | Planet longitude relative to the central meridion (deg) |
| MU_OBS_COS | 75×150 | Cosine of the observer zenith angle |
| MUZ_SUN_COS | 75×150 | Cosine of the solar zenith angle |
| AZIMUTH | 75×150 | Angle between projections of the vectors from the sun to Uranus, and from Uranus to the observer, onto the tangent plane at the observed location on the planet (deg) |
The spectral intensity I/F is the ratio, as a function of wavelength, of the observed radiance to that of a normally-illuminated Lambertian reflector at the same distance from the sun as the target.
The dispersion relation is defined by WCS keywords in the header of the SCI extension, but discrete values appear in the WAVELENGTH extension; they are equivalent at the center of each pixel, and both forms are included for convenience. An approximation to the planetographic coordinate system is represented in one of the FITS WCS systems, with the label "G". These coordinates are for convenience only: actual coordinates should be taken from the image extensions that contain the computed planet coordinates. See the README file for details.
An example IDL program, uranus-stis_read_example.pro, is provided to illustrate how to access the pixel data and coordinate information from the science files, to display an average of the image over a particular range of wavelengths, and to plot the spectrum over a range of planetographic coordinates.
The FITS primary headers include all the constituent STIS observation IDs that were combined to produce the merged spectrum, in keywords with names like ROOTNMnn.
Data Access
This HLSP collection is available via this DOI: dx.doi.org/10.17909/T9KQ4N. Alternatively, download the individual FITS files via links in Table 2 below.
| Epoch | HST Program | Description Paper | Sub-obs. latitude | File |
|---|---|---|---|---|
| 2002-Aug. | GO–9035 | Karkoschka & Tomasko (2009) | 20.5° S | FITS file |
| 2012-Sep. | GO–12894 | Sromovsky et al. (2014) | 19.5° N | FITS file |
| 2015-Oct. | GO–14113 | Sromovsky et al. (2018) | 31.7° N | FITS file |
Please remember to cite the appropriate paper(s) above and the DOI if you use these data in a published work.
Note: These HLSP data products are licensed for use under CC BY 4.0.
|
|
|