Hubble Legacy Fields Data Release V2.5
The GOODS-N and GOODS-S Regions
Highlights of the Hubble Legacy Fields (HLF)
- The largest High Level Science Product (HLSP) data release to date, with the HLF-GOODS-S (AR-13252) incorporating 7491 individual HST exposures, totaling 6.4 million seconds and the HLF-GOODS-N (AR-15027) incorporating 5817 exposures totaling 3.6 million seconds. A combined total of 13308 individual HST exposures, totaling 10 million seconds.
- Includes essentially all ultraviolet, optical and infrared imaging data taken by Hubble over 18 years across the GOODS-North and GOODS-South regions including the original GOODS-N/S, HUDF, CANDELS, ERS, HUDF09/12, UVUDF, HDUV and many other programs.
- All images use a coordinate grid tied to the Gaia DR2 reference frame; we also provide results on the original GOODS-N/S coordinate system.
- The HLF-GOODS-N WFC3/UV dataset includes data from the CANDELS UV program.
- A photometric catalog is provided for each of the 13 HST bandpasses used in the HLF GOODS-S dataset.
- The HLF-GOODS-S dataset includes 5 deep regions, the original HUDF (now as the XDF dataset) and four newer regions (HLF-HUDF parallels) that are strikingly deep in subsets of the 13 filters.
Overview
This describes the V2.5 version data release of the Hubble Legacy Fields (HLF) project for the GOODS-North and GOODS-South regions from the HST archival programs AR-13252 and AR-15027. The V2.5 version of the HLF dataset provides WFC3/UV, ACS/WFC and WFC3/IR source catalogs and image mosaics covering a 25 x 25 arcminute area plus (smaller) cutouts of four deep areas in the GOODS-South field and image mosaics covering a 20.5 x 20.5 arcminute area in the GOODS-North field. All the data covering the original HUDF field within the GOODS-South area were previously released as a high level science product as the eXtreme Deep Field (XDF — sometimes referred to as the XDF/HUDF field).
HLF Release: The release combines exposures from Hubble's two main cameras, the Advanced Camera for Surveys Wide Field Channel (ACS/WFC) and the Wide Field Camera 3 (WFC3), including data from both the infrared channel (WFC3/IR) and the UV/visible channel (WFC3/UVIS). These data were taken over more than a decade between mid-2002 to the end of 2020. The HLF includes essentially all the near-uv (WFC3/UV F225W, F275W, F336W), optical (ACS/WFC F435W, F606W, F775W, F814W and F850LP filters) and infrared (WFC3/IR F098M, F105W, F125W, F140W and F160W filters) filters. The HLF includes data taken by Hubble over the original CDF-North/South region including the GOODS-N/S, CANDELS, ERS, the Extended CDF-S (ECDF-S), numerous SNe followup programs, and many other programs. Given that this dataset combines all images in the archive on the ECDF-S to date from numerous different programs, the HST AR-13252 and AR-15027 proposals identified the product under a single global name "Hubble Legacy Fields".
Astrometric Frame: A particularly challenging aspect, given the large area, was to establish a robust astrometric framework. A global astrometric solution was bootstrapped from the smaller datasets. All the HLF image mosaics have been produced using a coordinate grid tied to an absolute Gaia DR2 reference frame. We also provide an alternate coordinate system using the same tangent point as the original GOODS-N/S datasets.
Exposure Time: The total HST on-target exposure time of all the data incorporated in the HLF-GOODS-N is 3.6 Msec and 6.4 MSec in the HLF-GOODS-S. The HLF-GOODS-N and HLF-GOODS-S dataset are derived from 5817 and 7491 exposures, respectively, and taken from 33 different HST programs. This on-target exposure time is equivalent to that of about 4181 orbits (assuming that the exposure in a typical orbit is 2400s). This total exposure corresponds to over ~120% of a full HST resource cycle! The HLF dataset also includes four very deep pointings from observations made in parallel when HUDF was primary (the HLF-HUDFP1-4 parallel fields). Unlike the XDF/HUDF, these parallel fields have a smaller set of filters and have varying depths, but still constitute a resource of unusually deep fields.
Catalog: A catalog of all the sources in the HLF GOODS-South dataset, with photometry for sources in each of the 13 filters, is also made available with this release. The photometric catalog includes 103,098 objects, selected in either of two near-IR filters (F850LP and F160W). The photometric results are measured in 0.7′′ diameter apertures and corrected to total fluxes based on the F160W curve of growth.
HLF Team: The HLF Team is The HLF Team is Garth Illingworth, Daniel Magee, Rychard Bouwens, Pascal Oesch, Kate Whitaker, Ivo Labbe, Pieter van Dokkum, Mauro Stefanon, Bradford Holden, Marijn Franx, and Valentino Gonzalez. The catalog was led by Katherine Whitaker. Please credit Illingworth et al 2019 when using the HLF HSLP data and products, and Whitaker et al 2019 for the catalog. The UVUDF dataset was graciously provided by Harry Teplitz, Anton Koekemoer, Marc Rafelski, Norman Grogin and the UVUDF Team. If you use any of the HLF-GOODS-S UV data, please also cite Teplitz et al. 2013 and Rafelski et al. 2015.
What's new in V2.5
The HLF V2.5 includes the release of the HLF-GOODS-N dataset. The HLF-GOODS-N comprises 5817 exposures taken over nearly 18 years with WFC3/UVIS, ACS/WFC and WFC3/IR totaling 3.6 million seconds. This is 1516 orbits of data or about 50% of a full one-year Cycle. Note that a substantial fraction (~59%) of these data have never been available as a high-level data product. HLF-GOODS-N dataset incorporates 11 filters consisting of two WFC3/UVIS, five ACS/WFC and four WFC3/IR filters
What's in V2.0
A major change from the HLF-GOODS-S V1.5 data release to the V2.0 release is the inclusion of three UV datasets. These sets constitute a substantial body of UV data, totaling 280 orbits of HST WFC3/UVIS imaging, or about 0.5 Msec of data. The three UV datasets are the Early Release Science (ERS) observations (Windhorst et al 2011), the UltraViolet Ultra-Deep Field (UVUDF) dataset (Teplitz et al. 2013, Rafelski et al. 2015) and the Hubble Deep UltraViolet (HDUV) legacy dataset (Oesch et al 2018, see also Vanzella et al 2016). These datasets were updated and astrometrically matched to the V1.5/V2.0 release of the HLF-GOODS-S. The ERS dataset required a full reprocessing since that has not be available in processed form on MAST. Thus the HLF provides for the first time the release of the WFC3/UV 2009 ERS dataset as a HLSP.
The steps that were taken to assemble the HST UV data along with the HST optical and near-IR data are described in the paper that discusses the assembly of the HLF-GOODS-S dataset (Illingworth et al 2021).
As noted above the V2.0 release now includes a catalog of over 100,000 sources with photometry in all 13 filters (or those sources for which the S/N was adequate for inclusion). See Whitaker et al 2019.
Additionally, we have organized the ACS/WFC and WFC3/IR data into twelve one year epochs from the fourteen years of observations on the ECDF-S, starting with the first epoch from May 2002 to April 2003 (there were two years where no significant additional data was obtained due to ACS/WFC failure in January 2007). See hlf_goodss_v2_epoch_by_filter.pdf.
Observations
The HLF-GOODS-N Field
| Field | RA | Dec | Epoch |
|---|---|---|---|
| HLF-GOODS-N | 12h36m44s | 62d14m25s | J2000 |
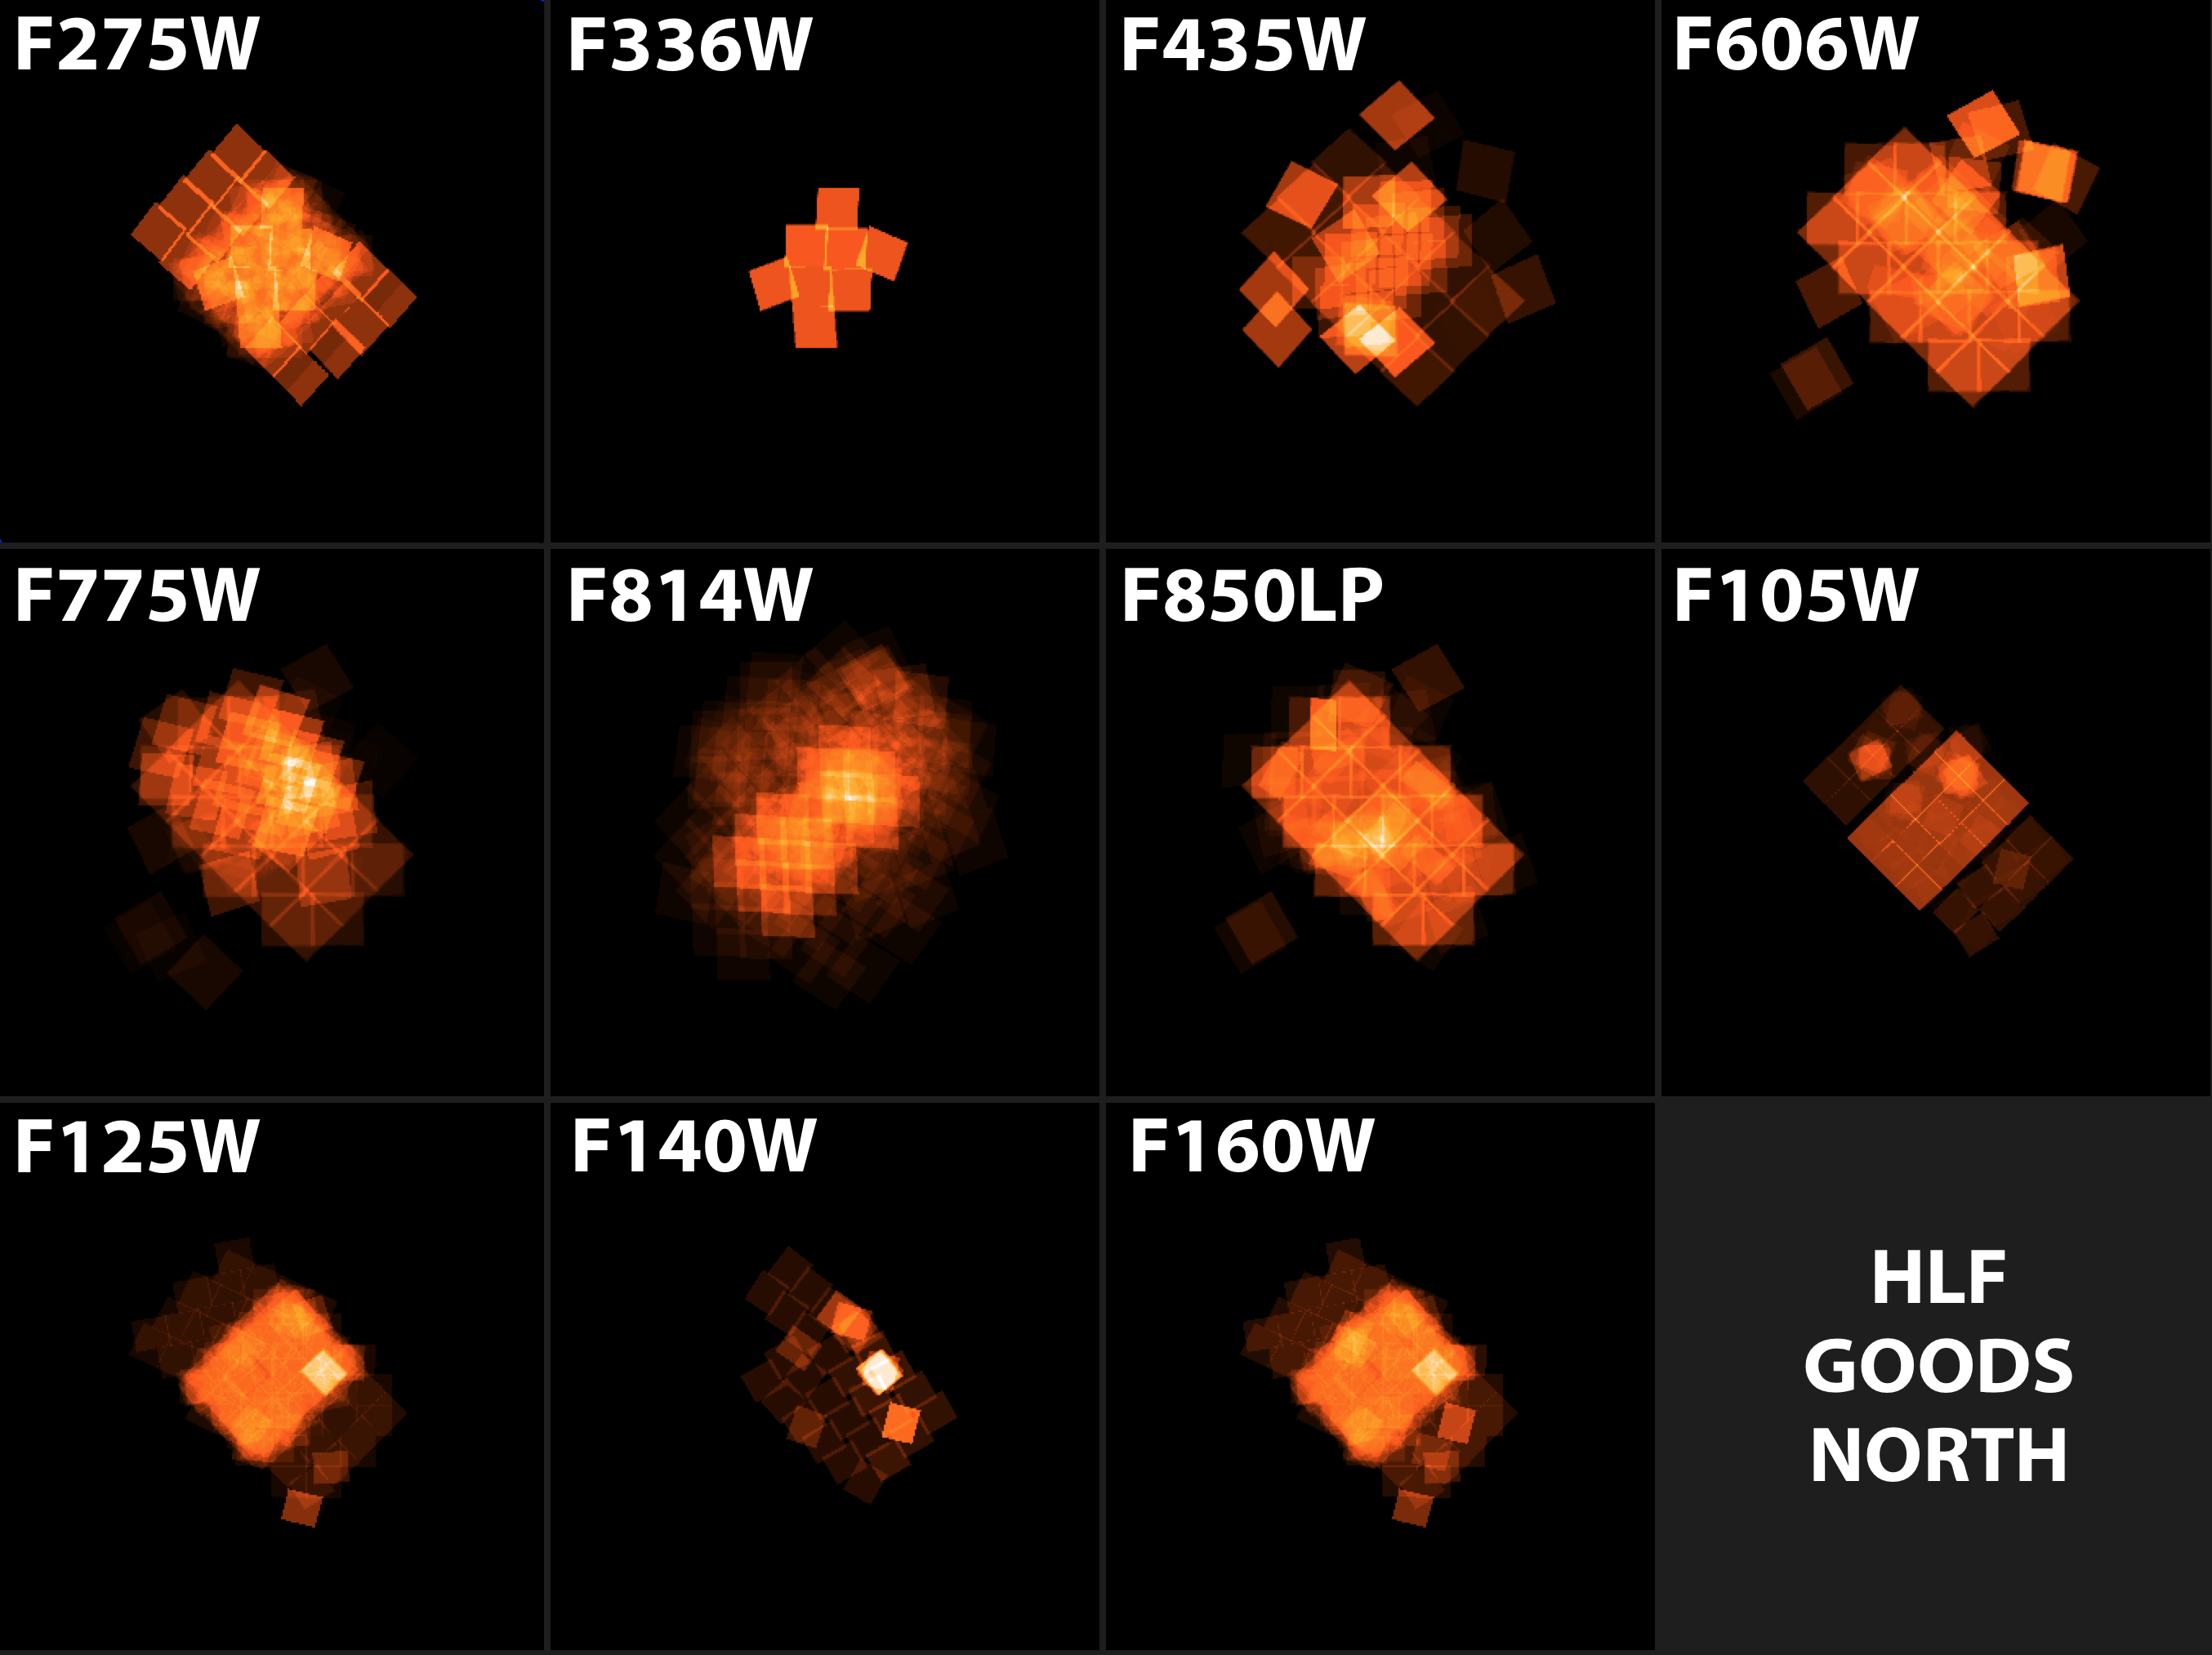
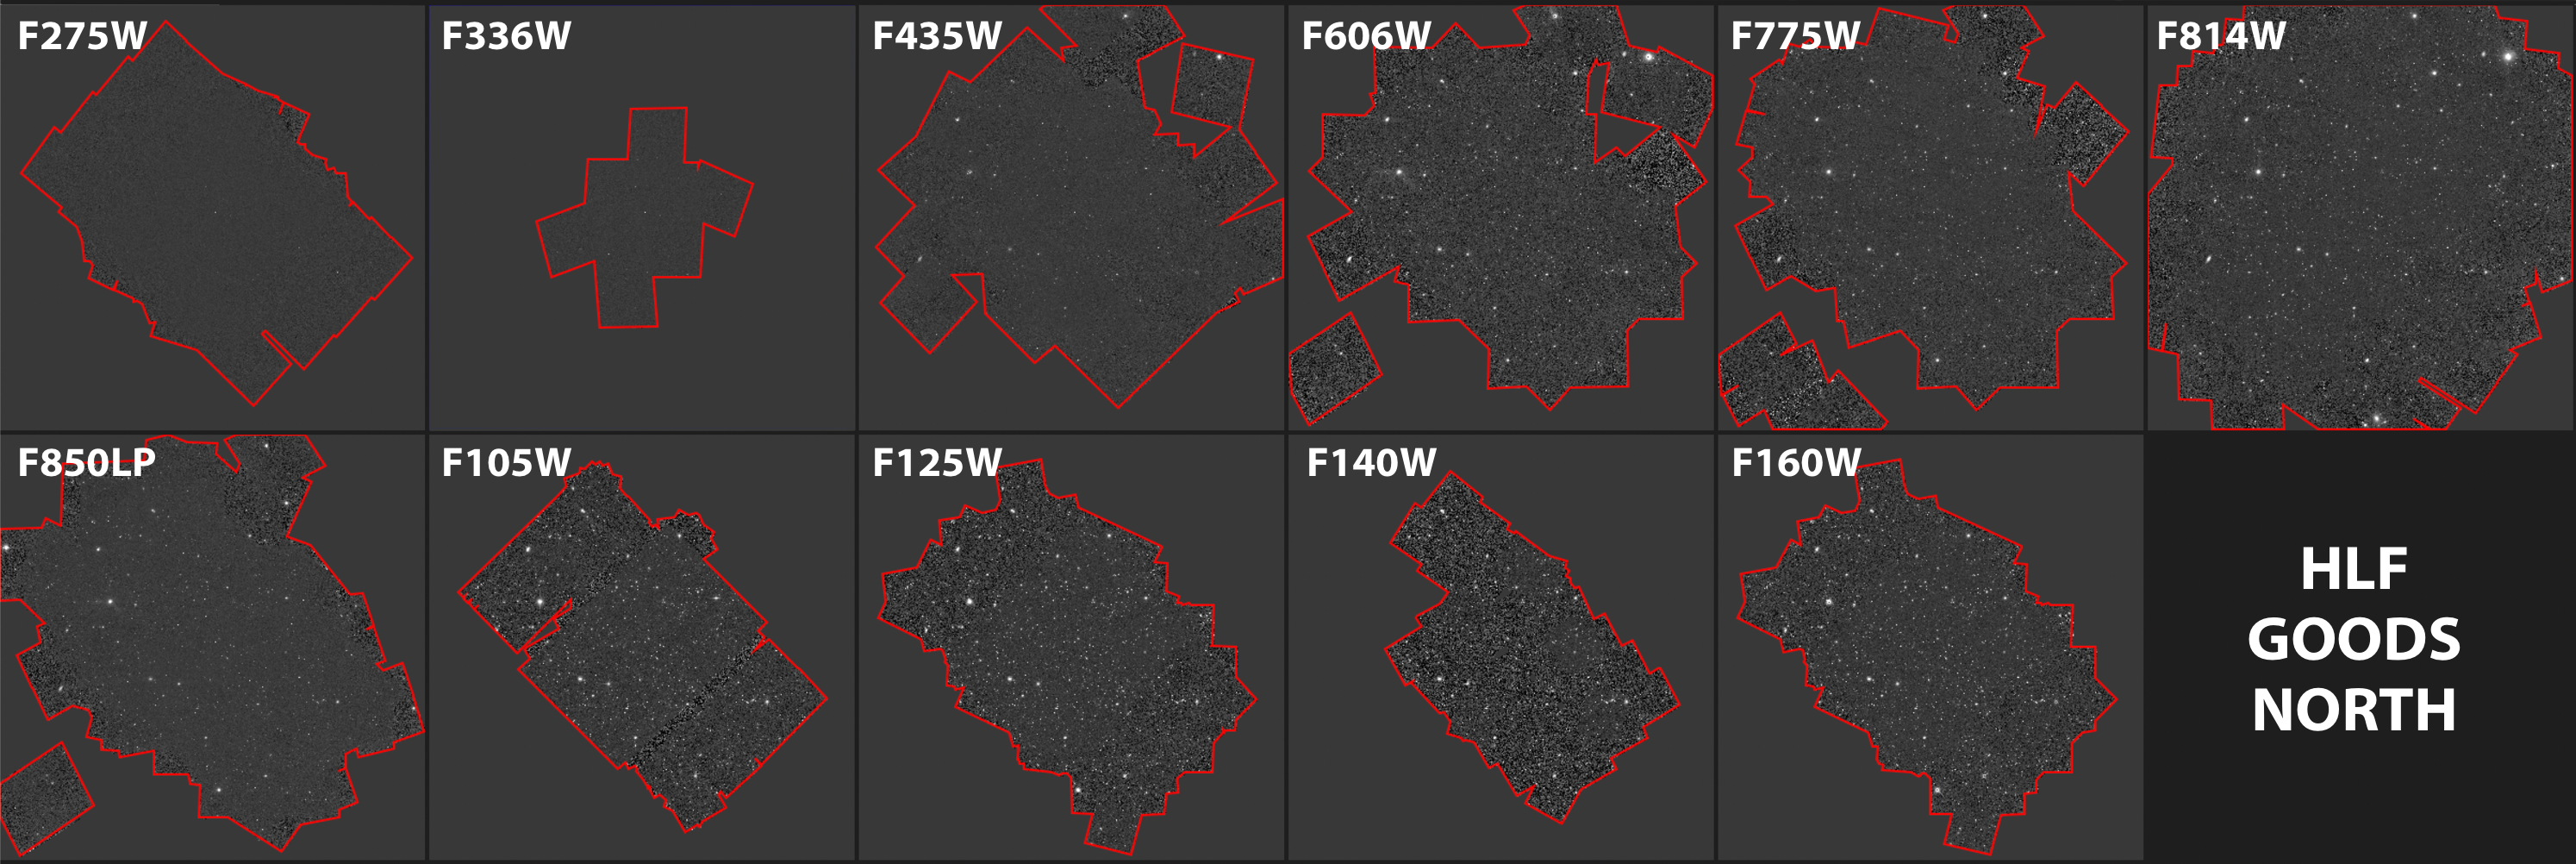
Shown (left) is the exposure time maps of the regions covered by each filter in the HLF-GOODS-N HLSP dataset. The filters include a total of 11 WFC3/UV, ACS/WFC and WFC3/IR filters (F275W, F336W, F435W, F606W, F775W, F814W, F850LP, F105W, F125W, F140W & F160W). The maps here total ~5800 exposures that comprise the HLF-GOODS-N dataset.
Exposure Times for HLF-GOODS-N Field
Observations included in this version of the HLF-GOODS-N Field were taken from July 2002 to November 2018 from 29 different HST programs.
| Filter | Exposure Time (s) | # of Exposures |
|---|---|---|
| HLF-GOODS-N Field | ||
| F275W | 390386 | 237 |
| F336W | 154512 | 64 |
| F435W | 520936 | 623 |
| F606W | 145877 | 317 |
| F775W | 341478 | 635 |
| F814W | 618824 | 1163 |
| F850LP | 625392 | 1320 |
| F105W | 231306 | 337 |
| F125W | 256718 | 449 |
| F140W | 53364 | 192 |
| F160W | 293676 | 469 |
| Totals | 3637709 | 5817 |
Exposure Times for HLF-GOODS-N Field
| Program ID | Program Title | Program PI |
|---|---|---|
| 9301 | Photometry and Grism Spectroscopy in HDF North/South | Ford, Holland |
| 9352 | The Deceleration Test from Treasury Type Ia Supernovae at Redshifts 1.2 to 1.6 | Riess, Adam |
| 9468 | ACS Grism Parallel Survey of Emission- line Galaxies at Redshift z pl 7 | Yan, Lin |
| 9480 | Cosmic Shear With ACS Pure Parallels | Rhodes, Jason D. |
| 9583 | The Great Observatories Origins Deep Survey: Imaging with ACS | Giavalisco, Mauro |
| 9727 | Exploration of the SN Ia Hubble Diagram at z > 1.2 | Perlmutter, Saul |
| 9728 | Tracing the History of Cosmic Expansion to z~2 with Type Ia Supernovae | Riess, Adam |
| 9984 | Cosmic Shear With ACS Pure Parallels | Rhodes, Jason D. |
| 10189 | PANS-Probing Acceleration Now with Supernovae | Riess, Adam |
| 10339 | PANS | Riess, Adam |
| 10530 | Probing Evolution And Reionization Spectroscopically {PEARS} | Malhotra, Sangeeta |
| 10771 | CTE and QE measurement for ACS CCDs at three different temperatures | Sirianni, Marco |
| 11600 | Star formation, extinction and metallicity at 0.7<z<1.5: H-alpha fluxes and sizes from a grism survey of GOODS-N | Weiner, Benjamin |
| 12385 | External CTE Monitor | Chiaberge, Marco |
| 12442 | Cosmic Assembly Near-IR Deep Extragalactic Legacy Survey -- GOODS-North Field, Non-SNe-Searched Visits | Faber, Sandra M. |
| 12443 | Galaxy Assembly and the Evolution of Structure over the First Third of Cosmic Time - III | Faber, Sandra M. |
| 12444 | Cosmic Assembly Near-IR Deep Extragalactic Legacy Survey -- GOODS-North Field, Middle Visits of SNe Search | Faber, Sandra M. |
| 12445 | Cosmic Assembly Near-IR Deep Extragalactic Legacy Survey -- GOODS-North Field, Late Visits of SNe Search | Faber, Sandra M. |
| 12461 | Supernova Follow-up for MCT | Riess, Adam |
| 12960 | The nature of star formation in two spectroscopically confirmed exceptionally-luminous galaxies beyond a redshift 7 | Ono, Yoshiaki |
| 13063 | Supernova Follow-up for MCT | Riess, Adam |
| 13420 | The progenitors of quiescent galaxies at z~2: precision ages and star-formation histories from WFC3/IR spectroscopy | Barro, Guillermo |
| 13779 | The Faint Infrared Grism Survey (FIGS) | Malhotra, Sangeeta |
| 13871 | A Spectroscopic Redshift for the Most Luminous Galaxy Candidate at z~10 | Oesch, Pascal |
| 13872 | The GOODS UV Legacy Fields: A Full Census of Faint Star-Forming Galaxies at z~0.5-2 | Oesch, Pascal |
| 14227 | The CANDELS Lyman-alpha Emission At Reionization (CLEAR) Experiment | Papovich, Casey |
| 15187 | Confirmation of the Most Distant Quasar | Tilvi, Vithal |
| 15647 | Ultraviolet Imaging of the Cosmic Assembly Near-infrared Deep Extragalactic Legacy Survey Fields (UVCANDELS) | Teplitz, Harry |
| 15977 | Characterizing the Environment Around The Most Distant Known Galaxy | Oesch, Pascal |
The HLF-GOODS-S Field
| Field | RA | Dec | Epoch |
|---|---|---|---|
| HLF-GOODS-S | 3h32m29s | -27d48m18s | J2000 |
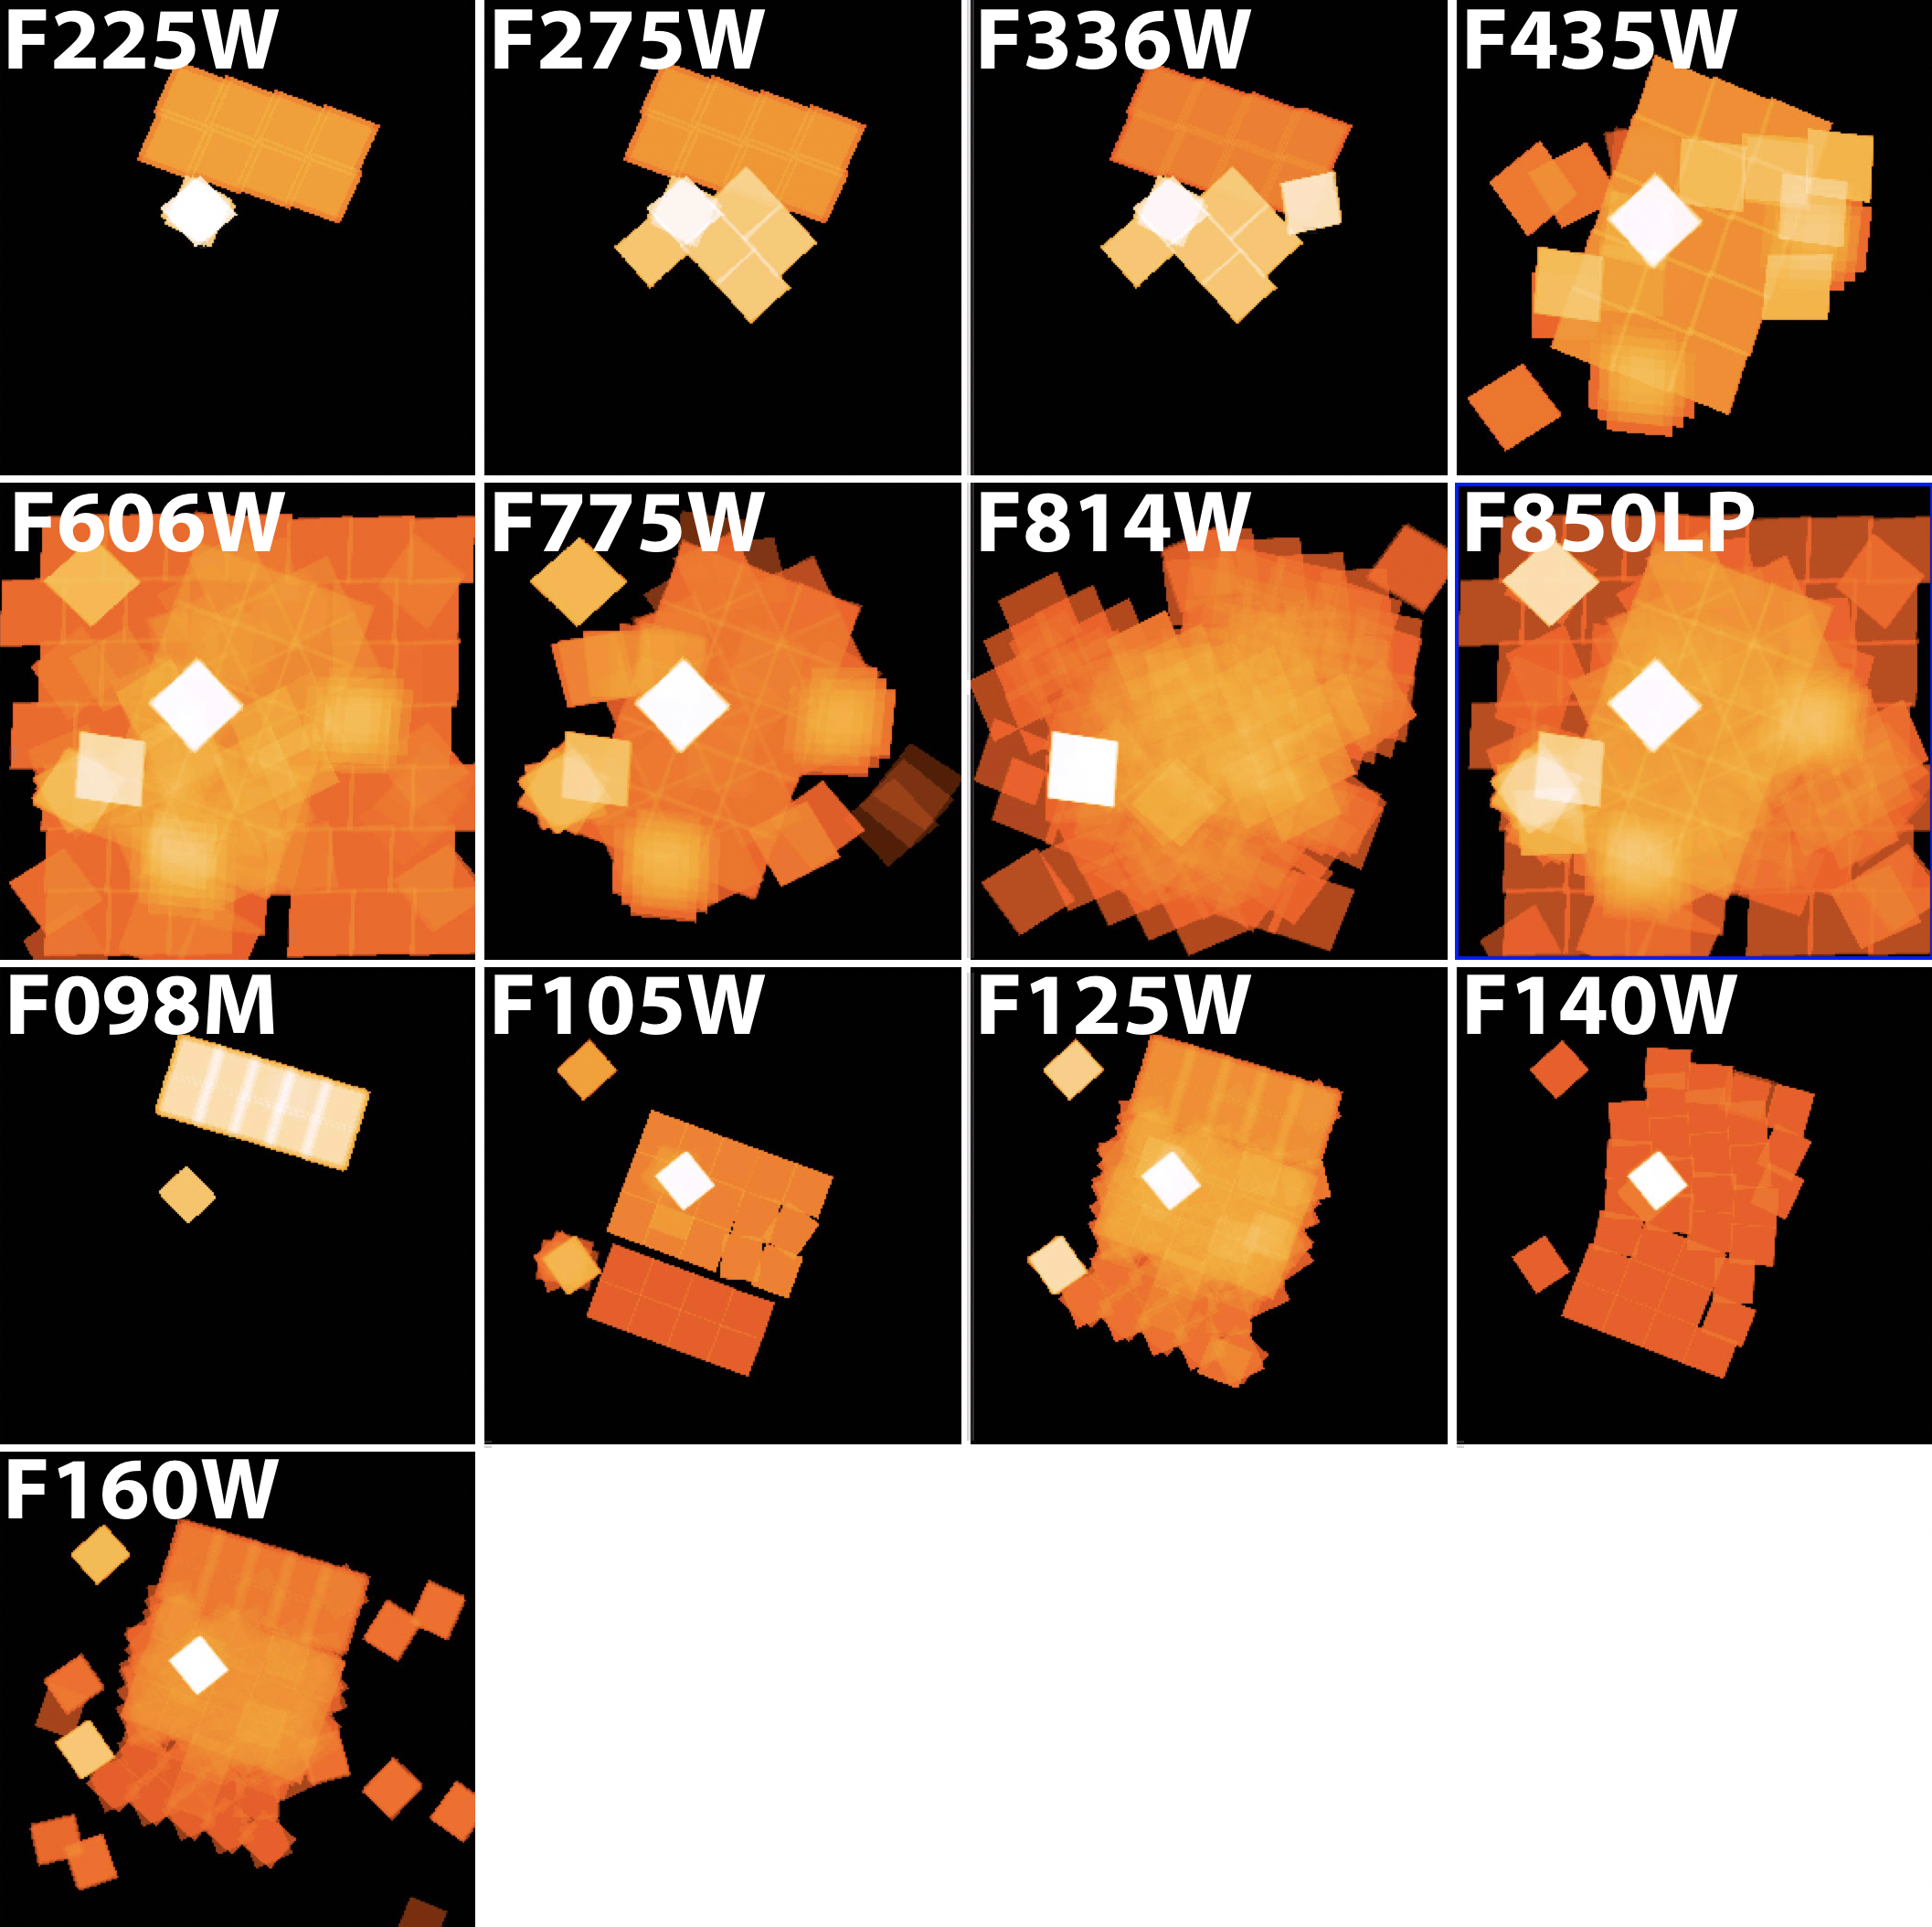
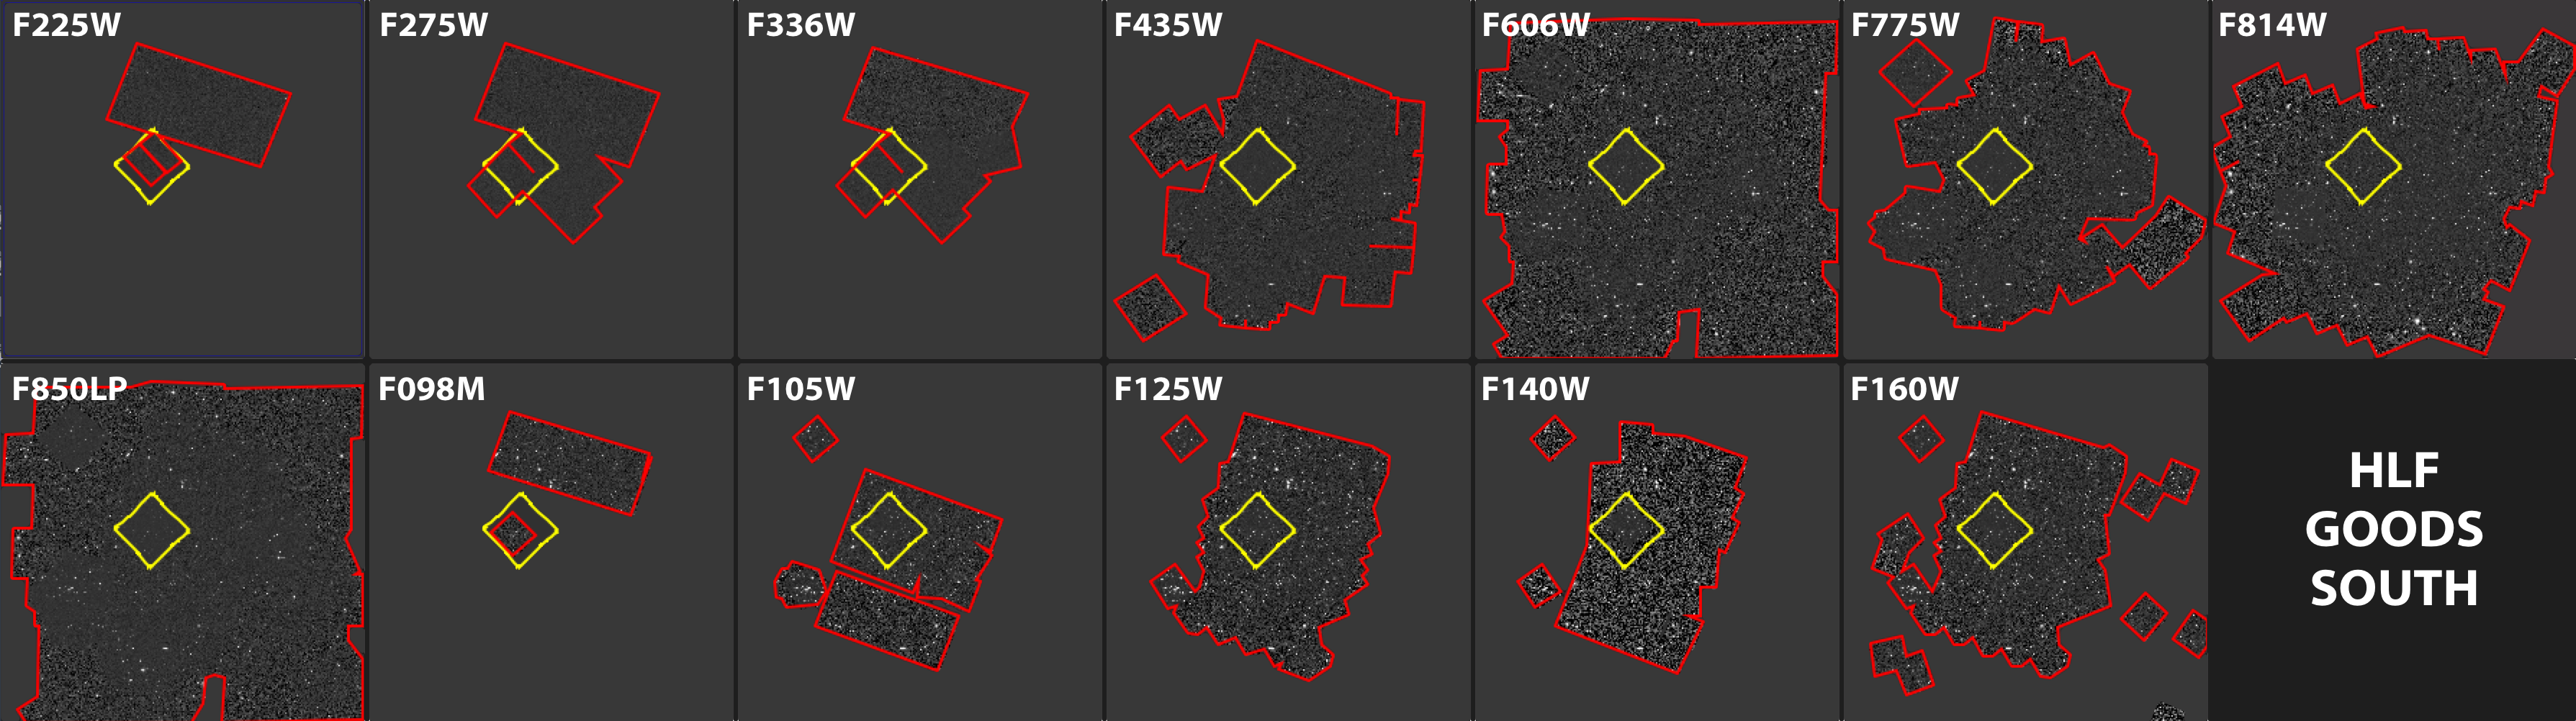
Shown (left) is the exposure time maps of the regions covered by each filter in the HLF-GOODS-S HLSP dataset. The XDF/HUDF region is in white indicating the deepest data. The filters include a total of 13 WFC3/UV, ACS/WFC and WFC3/IR filters (F225W, F275W, F336W, F435W, F606W, F775W, F814W, F850LP, F098M, F105W, F125W, F140W & F160W). The maps here total ~7500 exposures that comprise the HLF-GOODS-S dataset.
The HLF-HUDF Parallel Deep Fields
| Field | RA | Dec | Epoch |
|---|---|---|---|
| HLF-HUDFP1 | 3h33m04s | -27d41m02s | J2000.0 |
| HLF-HUDFP2 | 3h33m01s | -27d50m50s | J2000.0 |
| HLF-HUDFP3 | 3h32m42s | -27d55m17s | J2000.0 |
| HLF-HUDFP4 | 3h32m01s | -27d48m17s | J2000.0 |

The five deep regions within HLF-GOODS-S (HUDF parallels in red and the XDF/HUDF in yellow). Each of these deep regions constitutes an usually deep set of observations, though with varying depth and reduced numbers of filters compared to the XDF/HUDF.
Exposure Times for HLF-GOODS-S Field
Observations included in this version of the HLF-GOODS-S Field were taken from July 2002 to October 2016 from 33 different HST programs.
| Filter | Exposure Time (s) | # of Exposures |
|---|---|---|
| HLF-GOODS-S Field | ||
| F225W | 89576 | 64 |
| F275W | 207222 | 108 |
| F336W | 216150 | 108 |
| F435W | 526952 | 443 |
| F606W | 537944 | 712 |
| F775W | 770190 | 849 |
| F814W | 840211 | 1288 |
| F850LP | 1495092 | 1902 |
| F098M | 53499 | 68 |
| F105W | 484734 | 429 |
| F125W | 440755 | 598 |
| F140W | 115590 | 218 |
| F160W | 596277 | 704 |
| Totals | 6374192 | 7491 |
Programs Used for HLF-GOODS-S Field
| Program ID | Program Title | Program PI |
|---|---|---|
| 9352 | The Deceleration Test from Treasury Type Ia Supernovae at Redshifts 1.2 to 1.6 | Adam Riess |
| 9425 | The Great Observatories Origins Deep Survey: Imaging with ACS | Mauro Giavalisco |
| 9480 | Cosmic Shear With ACS Pure Parallels | Jason D. Rhodes |
| 9488 | Cosmic Shear - with ACS Pure Parallel Observations | Kavan Ratnatunga |
| 9500 | The Evolution of Galaxy Structure from 10, 000 Galaxies with 0.1<z<1.2 | Hans-Walter Rix |
| 9575 | ACS Default {Archival} Pure Parallel Program | William B. Sparks |
| 9793 | The Grism-ACS Program for Extragalactic Science {GRAPES} | Sangeeta Malhotra |
| 9803 | Deep NICMOS Images of the UDF | Rodger I. Thompson |
| 9978 | The Ultra Deep Field with ACS | Steven Beckwith |
| 9984 | Cosmic Shear With ACS Pure Parallels | Jason D. Rhodes |
| 10086 | The Ultra Deep Field with ACS | Steven Beckwith |
| 10189 | PANS-Probing Acceleration Now with Supernovae | Adam Riess |
| 10258 | Tracing the Emergence of the Hubble Sequence Among the Most Luminous and Massive Galaxies | Claudia Kretchmer |
| 10340 | PANS | Adam Riess |
| 10530 | Probing Evolution And Reionization Spectroscopically {PEARS} | Sangeeta Malhotra |
| 10632 | Searching for galaxies at z>6.5 in the Hubble Ultra Deep Field | Massimo Stiavelli |
| 11144 | Building on the Significant NICMOS Investment in GOODS: A Bright, Wide-Area Search for z>=7 Galaxies | Rychard Bouwens |
| 11359 | Panchromatic WFC3 survey of galaxies at intermediate z: Early Release Science program for Wide Field Camera 3. | Robert W. O'Connell |
| 11563 | Galaxies at z~7-10 in the Reionization Epoch: Luminosity Functions to <0.2L* from Deep IR Imaging of the HUDF and HUDF05 Fields | Garth D. Illingworth |
| 12007 | Supernova Followup | Garth D. Illingworth |
| 12060 | Cosmic Assembly Near-IR Deep Extragalactic Legacy Survey — GOODS-South Field, Non-SNe-Searched Visits | Sandra M. Faber |
| 12061 | Cosmic Assembly Near-IR Deep Extragalactic Legacy Survey — GOODS-South Field, Early Visits of SNe Search | Sandra M. Faber |
| 12062 | Galaxy Assembly and the Evolution of Structure over the First Third of Cosmic Time - III | Sandra M. Faber |
| 12099 | Supernova Follow-up for MCT | Adam Riess |
| 12177 | 3D-HST: A Spectroscopic Galaxy Evolution Treasury | Pieter Van Dokkum |
| 12461 | Supernova Follow-up for MCT | Adam Riess |
| 12498 | Did Galaxies Reionize the Universe? | Richard S. Ellis |
| 12534 | The Panchromatic Hubble Ultra Deep Field: Ultraviolet Coverage | Harry Teplitz |
| 12866 | A Morphological Study of ALMA Identified Sub-mm Galaxies with HST/WFC3 | Mark Swinbank |
| 12990 | Size Growth at the Top: WFC3 Imaging of Ultra-Massive Galaxies at 2.0 < z < 3 | Adam Muzzin |
| 13779 | The Faint Infrared Grism Survey (FIGS) | Sangeeta Malhotra |
| 13872 | The GOODS UV Legacy Fields: A Full Census of Faint Star-Forming Galaxies at z~0.5-2 | Pascal Oesch |
| 14088 | Unveiling the Lyman continuum morphology with HST | Eros Vanzella |
Data Products
Images
This release includes fully reduced, science ready images (*_sci.fits) together with the associated weight maps (*_wht.fits) at 30mas/pixel (for WFC3/UV and ACS only) and 60mas/pixel (for ACS+WFC3/UV/IR images) and source catalogs.
HLF-GOODS-N
The data are organized into sets of images by passband (WFC3/UV F275W & F336W, ACS/WFC F435W, F606W, F775W, F814W & F850LP, WFC3/IR F105W, F125W, F140W & F160W) and image scale. Each 60 milli-arcsecond/pixel HLF-GOODS-N image is 20.5k x 20.5k pixels and each 30 milli-arcsecond/pixel image is 41k x 41k pixels. For each filter we provide the drizzled science image and a weight image. The HLF V2.5 contains the first release of the HLF-GOODS-N dataset.
HLF-GOODS-S
The current version of the HLF-GOODS-S data is at V2.0. We hope to provide a V2.5 in the future which will include new UV data. The data are organized into sets of images by passband (WFC3/UV F225W, F275W & F336W, ACS/WFC F435W, F606W, F775W, F814W & F850LP, WFC3/IR F098M, F105W, F125W, F140W & F160W) and image scale. Each 60 milli-arcsecond/pixel HLF-GOODS-N image is 25k x 25k pixels and each 30 milli-arcsecond/pixel image is 50k x 50k pixels. For each filter we provide the drizzled science image and a weight image. Previous data releases were made available in April 2016 and February 2017. The V2.0 supersedes the V1.0 dataset and the V1.5 dataset due to additional UV data and catalogs.
All images used a drizzle pixfrac parameter value of 0.8 (final_pixfrac=0.8). The weight map image is equal to the inverse variance (i.e., 1/rms^2) per pixel. A detailed discussion of weight map conventions and noise correlation in drizzling, can be found in Casertano et al. 2000, AJ, 120, 2747, especially Section 3.5 and Appendix A.
The data are viewable from a browser at:
http://archive.stsci.edu/hlsps/hlf
A script (hlsp_hlf_v2.0-v2.5_download.txt) is provided which uses the command line tool curl to download the entire dataset or can be edited to download only the files needed.
Zeropoints
The pixel values of the science images report the flux count rate calibrated in electron/second. The zero points to convert the count rate into an AB magnitude for five ACS/WFC passbands and the five WFC3/IR passbands are the following:
| Filter | Zero Point ABMAG |
|---|---|
| WFC3/UV | |
| F225W | 24.04 |
| F275W | 24.13 |
| F336W | 24.67 |
| ACS/WFC | |
| F435W | 25.68 |
| F606W | 26.51 |
| F775W | 25.69 |
| F814W | 25.94 |
| F850LP | 24.87 |
| WFC3/IR | |
| F098M | 25.68 |
| F105W | 26.27 |
| F125W | 26.23 |
| F140W | 26.45 |
| F160W | 25.94 |
Catalog
Catalogs are provided for the 13 HST bandpasses in the HLF-GOODS-S, including three WFC3/UV (F225W, F275W and F336W) filters, five ACS filters (F435W, F606W, F775W, F814W and F850LP) and five WFC3 filters (F098M, F105W, F125W, F140W and F160W). We use an ultra-deep detection image that combines the PSF-homogenized, noise-equalized F850LP, F125W, F140W and F160W mosaics. Photometry is extracted in 0.7′′ diameter apertures and corrected to total fluxes based on the F160W curve of growth. The photometric catalog includes 103,098 objects, with a suggested first selection based either (1) “use f160w”, which selects galaxies with S/N>3 in F160W and coverage in 5 HST bandpasses, or (2) “use f850lp”, which selects galaxies covering a wider on-sky area by requiring S/N>3 in F850LP but no minimum coverage of HST bandpasses.
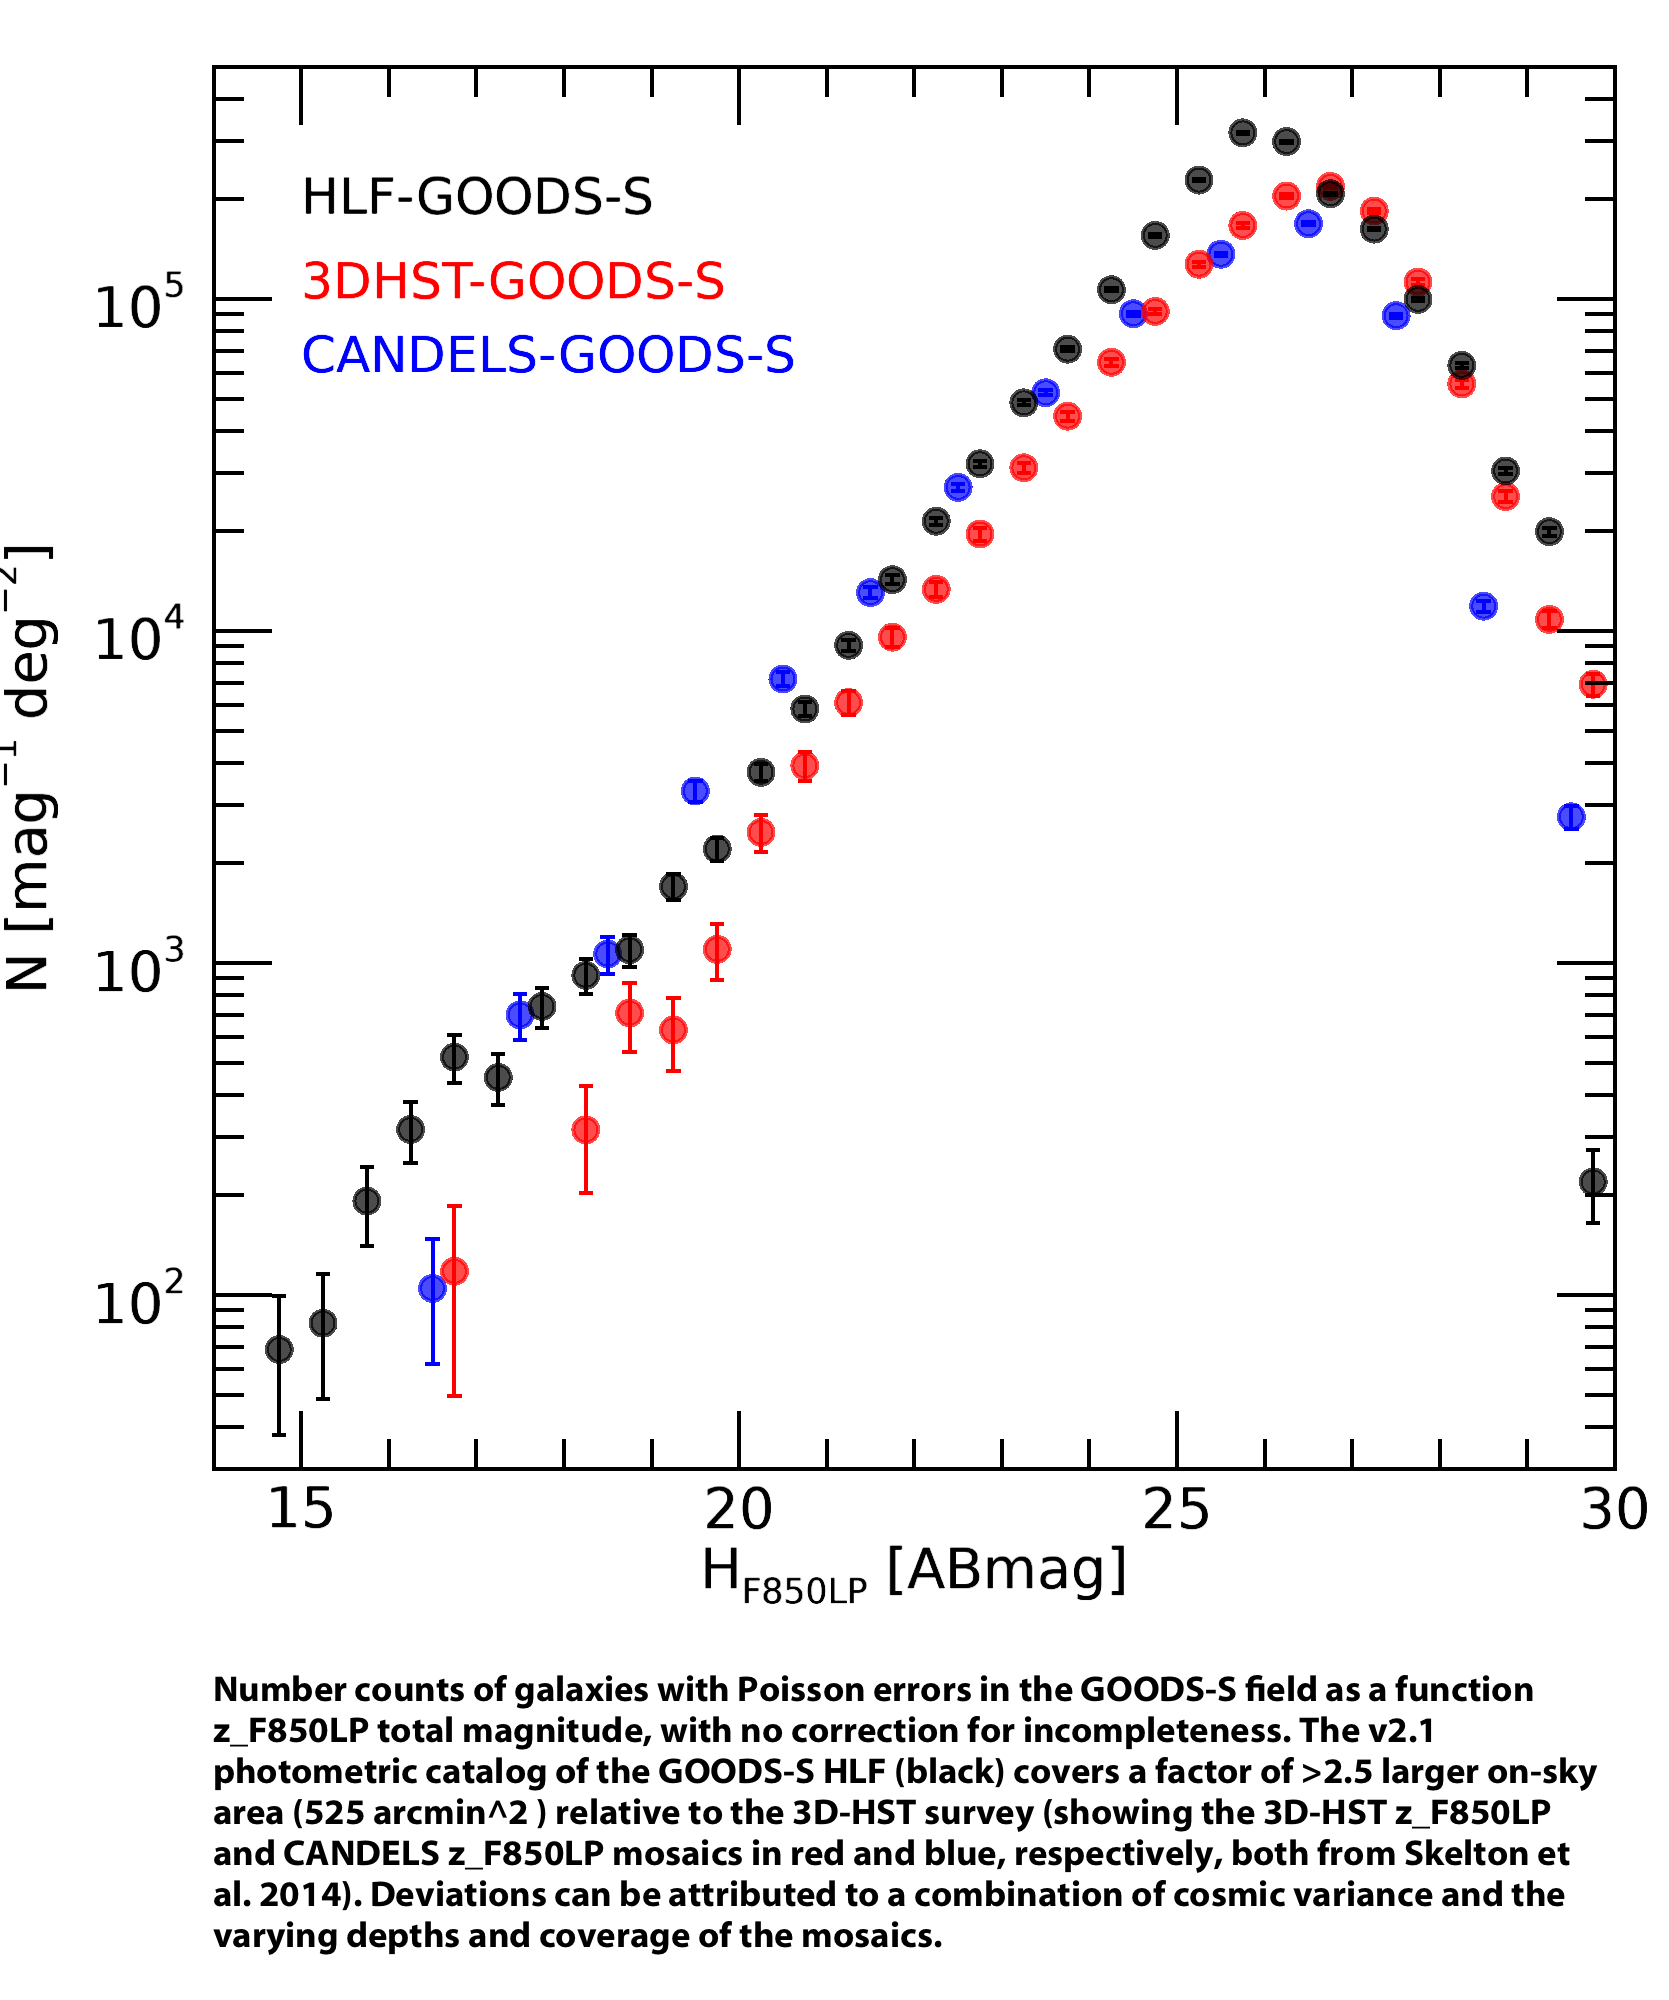
Update [5/28/2020]: The HLF-GOODS-S photometric catalog has been updated from v2.0 to v2.1. The only change is to reduce the relative weight threshold from 1% to 0.01%, as three filters with a combination of extremely deep and shallow pointings (e.g., F606W, F775W, and F850LP) had fluxes for about 50k-67k objects changed to -99 that may still be reliable. This increases the estimated area for F850LP coverage from 343 arcmin2 to 525 arcmin2 and could therefore be important for the shallow imaging coverage in these particular filters. Note that the only figure that slightly changes is the number counts comparison of F850LP (Figure 16), all other figures yield identical measurements to those presented in the publication.
Using the most up-to-date version v2.1 is recommended, though the catalog is largely unchanged.
Please cite Whitaker et al. 2019, ApJS, 244, 16
Convolved images and detection image used to create the V2.1 catalog can be found here: http://archive.stsci.edu/hlsps/hlf/v2.0/60mas_conv
| Type | Catalog | |
|---|---|---|
| HLF-GOODS-S Field - WFC3/UV, ACS/WFC & WFC3/IR | ||
| ASCII | hlsp_hlf_hst_goodss_v2.1_catalog.txt | |
| FITS | hlsp_hlf_hst_goodss_v2.1_catalog.fits | |
HLF Team
The HLF Team is The HLF Team is Garth Illingworth, Daniel Magee, Rychard Bouwens, Pascal Oesch, Kate Whitaker, Ivo Labbe, Pieter van Dokkum, Mauro Stefanon, Bradford Holden, Marijn Franx, and Valentino Gonzalez.
Citation
The description of the Hubble Legacy Fields high level science products delivered to MAST will be published. Please reference Illingworth, Magee, Bouwens, Oesch et al, 2019 and Whitaker, Ashas, Illingworth, Magee et al, 2019. If you use any of the HLF-GOODS-S UV data, please also cite Teplitz et al. 2013 and Rafelski et al. 2015.