XDF Data Release 1.0
Page Navigation
- Introduction
- Information on Observations
- Explore the Images with Interactive Displays
- Data Products, Zero Points, and Download Options
- Citation Information
Introduction
This summary describes the Hubble eXtreme Deep Field (XDF) project data release. The XDF includes all optical and infrared data taken by Hubble covering the original Hubble Ultra-Deep Field (HUDF) program, with just a few exceptions. Small amounts of data taken with unusual or rarely used filters and spectroscopic data are not included. The XDF also includes images which only partially cover the HUDF, as shown in the figure below. The weight maps are appropriately adjusted for the partial coverage.
The data used to generate the XDF were taken over the decade from mid-2002 to the end of 2012. The total exposure on the XDF is about 1.8 million seconds using data from Hubble's two main workhorse cameras, the Advanced Camera for Surveys Wide Field Channel (ACS/WFC) and the Wide Field Camera 3 InfraRed Channel (WFC3/IR). Substantial gains accrue from using all the ACS data taken over the decade since 2002, as well as from the improved processing techniques since the HUDF was released. The gains in the XDF are equivalent to adding about 180 orbits of data to the original HUDF dataset — split roughly equally between gains from improved processing techniques and from new data.
Further background on the XDF, including how and why this project was initiated, can be found at http://xdf.ucolick.org/xdf.html. The generation of the processed, combined and aligned images for the XDF was carried out over the last year by XDF team members Dan Magee, Pascal Oesch, Rychard Bouwens and Garth Illingworth (see Illingworth et al 2013). The XDF team can be found at http://xdf.ucolick.org/team.html.
The XDF Field
| Field | RA | Dec | Epoch | Primary ACS/WFC3IR Fields |
|---|---|---|---|---|
| XDF | 03:32:40.440 | -27:47:24.12 | J2000 | HUDF, HUDF09, HUDF12 |
The figure shows all the data that was used to generate the XDF. The XDF "blue diamond" is just inside the footprint of the original Hubble Ultra-Deep Field (HUDF) (PI: Steven Beckwith). The XDF excludes the some less-deep data around the very edges of the HUDF. The XDF ACS image is the sum of ALL the ACS data that overlaps, partially and fully, with the blue outlined area (including CANDELS and Supernova search fields, etc.) To ensure that the edges of the XDF field were dealt with adequately, and that the alignment was performed correctly, even to the edges, all the ACS image data within the black square was aligned and co-added. However, the depth in the area outside the blue diamond is quite limited and so it is not included in the XDF submission.
The "red rectangle" is the area of the deepest WFC3/IR images from the HUDF09 (PI: Garth Illingworth) and HUDF12 (PI: Richard Ellis) programs. WFC3/IR data from CANDELS (PI: Sandy Faber/Henry Ferguson) extends across the larger area of the ACS XDF region. For the WFC3/IR component of the XDF image we include all WFC3/IR data within the blue diamond outline, ranging from an extremely deep region in the red rectangle to shallower WFC3/IR images across the rest of the XDF (particularly for the F140W data). To access the deepest red rectangle data in the XDF quickly and easily we have provided information on how to do so below (under Data Products — Description).
In summary, the blue diamond is the XDF. The XDF includes all ACS and all WFC3/IR data from 2002 to the end of 2012 over the original HUDF ACS data. The WFC3/IR is matched to the blue "diamond", with the deepest HUDF09 plus HUDF12 data within the red rectangle. The ACS and WFC3/IR data used to create the color image for the HubbleSite XDF news release is covered by the red rectangle.
Back to top.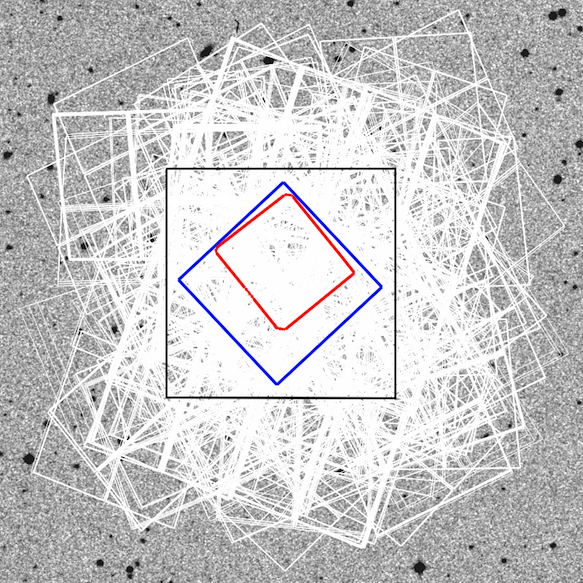
Observations
Description
Observations included in this version of the XDF were taken from July 2002 to December 2012 from 19 different HST programs. The table below lists the median exposure time (in kiloseconds) in the deepest parts of the ACS and WFC3/IR XDF images along with the total number of exposures combined in each filter.
| Filter | Median Exposure Time (ks) | # of Exposures |
|---|---|---|
| ACS/WFC Data | ||
| F435W | 152.4 | 164 |
| F606W | 174.4 | 286 |
| F775W | 377.8 | 460 |
| F814W | 50.8 | 362 |
| F850LP | 421.6 | 700 |
| WFC3/IR Data | ||
| F105W | 266.7 | 248 |
| F125W | 112.5 | 289 |
| F140W | 86.7 | 122 |
| F160W | 236.1 | 366 |
Programs Used
| Program ID | HST Cycle | Program Title |
|---|---|---|
| 9352 | 11 | The Deceleration Test from Treasury Type Ia Supernovae at Redshifts 1.2 to 1.6 |
| 9425 | 11 | The Great Observatories Origins Deep Survey: Imaging with ACS |
| 9488 | 11 | Cosmic Shear - with ACS Pure Parallel Observations |
| 9575 | 11 | ACS Default (Archival) Pure Parallel Program |
| 9793 | 12 | The Grism-ACS Program for Extragalactic Science (GRAPES) |
| 9978 | 12 | The Ultra Deep Field with ACS (HUDF)* |
| 10086 | 12 | The Ultra Deep Field with ACS (HUDF) |
| 10189 | 13 | Probing Acceleration Now with Supernovae (PANS) |
| 10258 | 13 | Tracing the Emergence of the Hubble Sequence Among the Most Luminous and Massive Galaxies |
| 10340 | 13 | Probing Acceleration Now with Supernovae (PANS) |
| 10530 | 14 | Probing Evolution And Reionization Spectroscopically (PEARS) |
| 11359 | 17 | Panchromatic WFC3 survey of galaxies at intermediate z: Early Release Science program for Wide Field Camera 3 (ERS) |
| 11563 | 17 | Galaxies at z~7-10 in the Reionization Epoch: Luminosity Functions to <0.2L* from Deep IR Imaging of the HUDF and HUDF05 Fields (HUDF09)* |
| 12060 | 18 | Cosmic Assembly Near-IR Deep Extragalactic Legacy Survey — GOODS-South Field, Non-SNe-Searched Visits (CANDELS) |
| 12061 | 18 | Cosmic Assembly Near-IR Deep Extragalactic Legacy Survey — GOODS-South Field, Early Visits of SNe Search (CANDELS) |
| 12062 | 18 | Galaxy Assembly and the Evolution of Structure over the First Third of Cosmic Time - III (CANDELS) |
| 12099 | 18 | Supernova Follow-up for MCT (CANDELS) |
| 12177 | 18 | 3D-HST: A Spectroscopic Galaxy Evolution Treasury (3DHST) |
| 12498 | 19 | Did Galaxies Reionize the Universe? (HUDF12)* |
| * largest contributions | ||
Data Processing
The process begins with individual flt files requested from the MAST HST archive. These images have already been subject to bias correction, dark subtraction, flat-field correction, and cosmic ray rejection. The flt files obtained from the MAST are reasonably well calibrated, given that the on-the-fly pipeline processing by STScI already takes advantage of darks and flat fields constructed from latest on-orbit calibration data. However, in some cases further instrument specific processing is required as described below.
All images used to produce the XDF were first visually inspected to identify any data quality issues (loss of guiding, excessive background, pointing inaccuracies). Any image which could not be corrected was rejected and not processed. During this visual inspection we also identify images affect by satellite trials and optical ghosts from filter reflections generated by bright stars (ACS) and updated the data quality array to ensure that these artifacts were masked during final processing.
For ACS/WFC data taken after HST Servicing Mission 4 (SM4) we also applied corrections for charge transfer efficiency (CTE) degradation and removed bias striping noise.
ACS/WFC Data
The XDF ACS/WFC dataset were reduced by the ACS GTO team data processing pipeline APSIS. For a detailed description of the reduction process please refer to "An Automatic Image Reduction Pipeline for the Advanced Camera for Surveys" Blakeslee, et.al. 2003. In order to improve the reductions of the XDF ACS/WFC dataset we applied one additional correction not performed by APSIS.
To optimize the pixel-by-pixel S/N (and correct for any imperfections in the flats or darks), we median stacked all of the observations in the F435W, F606W, F775W, F814W & F850LP bands to create supermedian frames. These are subsequently subtracted from the individual images. To further optimize the pixel-by-pixel S/N in the reductions, we repeated the median stacks of exposures in each band — but now masking out the sources apparent in the final stacks (rather than just those apparent in the individual exposures). We then subtracted these supermedian images from of the each individual exposures and drizzled the data together to generate the final reductions.
WFC3/IR Data
The XDF WFC3/IR data were reduced by the HUDF09 team's WFC3/IR data reduction pipeline WFC3RED. The reduction process is described in "WFC3RED: A HST Wide Field Camera 3 Image Processing Pipeline" Magee, Bouwens & Illingworth 2007.
The WFC3RED processing of the WFC3/IR observations in the XDF follow the procedures in (Magee, Bouwens & Illingworth 2007), but with a few additional corrections in order to improve the reductions.
While most WFC3/IR flt files requested from MAST are ready for use (and stacking), in some cases CALWF3 can falsely flag nearly all pixels as cosmic rays. For WFC3/IR MultiAccum mode observations, CALWF3 assumes that accumulating background counts over the entire observation is a linear function. This assumption may not be the true for all observations. Depending on the circumstances for an observation the background count rate may vary over the duration of the observation. In order to determine if non-linearities in the background count rate are a problem, we compared the average exposure time in an flt file's TIME array extension with the exposure time listed in the header EXPTIME keyword. If we find the exposure time varies by more than 2% we introduce one additional step and sky subtract each of the individual readouts in the MultiAccum observation. This additional step ensures the background count rate is linear before reprocessing the image with CALWF3.
We also mask out pixels on WFC3/IR images that are affected by source persistence. This masking was performed by utilizing persistence models generated by the STScI WFC3 Persistence Project. A persistence model is created for each WFC3/IR exposure which incorporates an internal persistence model (persistence within a visit) and an external persistence model (persistence from earlier visits). Using the total (internal plus external) persistence model we flag all pixels above a threshold of 0.2 electrons/s to ensure that the final reductions are not significantly affected by source persistence.
To further refine the registration of images, we use MultiDrizzle to create image stacks for each visit and then cross-correlated the sources in each image stack with the HUDF F850LP-band images. Minor adjustments are made to the coordinates of each visit to obtain a more optimal alignment.
Finally, in order to improve the pixel-by-pixel S/N (and correct for any imperfections in the flats or darks), we median stacked all the observations in the F105W, F125W, F140W and F160W bands to create supermedian frames. These are subsequently subtracted from the individual images. To further optimize the pixel-by-pixel S/N in the reductions, we repeated the median stacks of exposures in each band — but now masking out the sources apparent in the final stacks (rather than just those apparent in the individual exposures). We then subtracted these supermedian images from each of the individual exposures and drizzled the data together to generate the final reductions.
Back to top.Data Products
Description
The data are organized into sets of images by XDF passband (ACS/WFC F435W, F606W, F775W, F814W & F850LP; WFC3/IR F105W, F125W, F140W & F160W) and image scale. We drizzle the data to two different scales — 60 mas and 30 mas. The ACS benefits from being drizzled to 30 mas because of its smaller pixels and the better PSF at shorter wavelengths, and so we provide the ACS data at this scale. For the WFC3/IR data 60 mas is more appropriate. We provide matched ACS and WFC3/IR data at the 60 mas scale. Each 60 milli-arcsecond/pixel image is approximately 5k x 5k and each 30 milli-arcsecond/pixel image is approximately 10k x 10k. For each filter we provide the science and weight image.
To access the deepest red rectangle WFC3/IR and corresponding ACS data in the XDF quickly and easily we have provided straightforward ways to isolate this region, as well as a the coordinates of the corners of that region. The RA and DEC coordinates (J2000, in degrees) of the corners of the red rectangle are:
[ (53.187414,-27.779152), (53.159507,-27.759633), (53.134517,-27.787144), (53.161906,-27.807208) ]
There is also: (1) A DS9 region overlay (hlsp_xdf_hst_deepest_ds9_v1.reg). (2) A simple flag file of "1" and "0" values is also provided (hlsp_xdf_hst_deepest_flag_v1.fits) that is unity everywhere except in the area of the deep red rectangle where it is filled with zero values. (3) The flag file can be referenced in the SExtractor configuration file for working just on the red rectangle region as:
FLAG_IMAGE hlsp_xdf_hst_deepest_flag_v1.fits # filename for an input FLAG-image
Nomenclature
The file names contain information relative to the passband (F105W, F125W, ...) the scale, the data release version (v1.0 in this case) and the image type (science image or a weight map). For example, the FITS file containing the F160W science data at 60 milli-arcsecond/pixel is called:
hlsp_xdf_hst_wfc3ir_F160W_60mas_v1_sci.fits
Interactive Displays
Interactively browse, zoom, and overlay source catalogs through the MAST Interactive Display, including 3-color composite images
Back to top.Data
These data may also be downloaded with anonymous ftp (ftp archive.stsci.edu then cd /pub/hlsp/xdf). The data are viewable from a browser at http://archive.stsci.edu/pub/hlsp/xdf. A script (hlsp_xdf_hst_download.txt) is provided which uses the command line tool curl to download the entire dataset or can be edited to download only the files needed.
Science Images
The pixel values of the science images report the flux count rate calibrated in electron/second. The zero points to convert the count rate into an AB magnitudes for five XDF ACS/WFC passbands and the four XDF WFC3/IR passbands are listed below.
| Filter | Zero Point ABMAG |
|---|---|
| ACS/WFC | |
| F435W | 25.68 |
| F606W | 26.51 |
| F775W | 25.69 |
| F814W | 25.94 |
| F850LP | 24.87 |
| WFC3/IR | |
| F105W | 26.27 |
| F125W | 26.23 |
| F140W | 26.45 |
| F160W | 25.94 |
Weight Map Image
The weight map image is generated by MultiDrizzle and is equal to the inverse variance (i.e., 1/rms^2) per pixel. A detailed discussion of weight map conventions and noise correlation in drizzling, can be found in Casertano et al. 2000, AJ, 120, 2747, especially Section 3.5 and Appendix A.
Citation
If you use this data in work that you publish, we'd appreciate it if you could acknowledge your use by including the following citation:
Illingworth et al. 2013 ApJS 209 6
The key people involved were XDF team members Dan Magee, Pascal Oesch, Rychard Bouwens and Garth Illingworth (for the full team see http://xdf.ucolick.org/team.html).
Back to top.Last update: 2013-03-29