The driving philosophy behind the NEWSIPS Project is to provide a homogeneous data product within a completely automated processing environment. An algorithm to compute background fluxes in high dispersion, BCKGRD, was designed with this philosophy. Although this algorithm generally provides a good background flux estimate, the results are not always optimal for particular regions of some images. A customized interactive determination of the background fluxes based on individual image characteristics can produce a more accurate estimate of the background in certain cases when data pathologies are present.
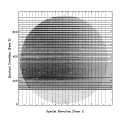
The determination of smoothed background fluxes follows the geometric resampling of pixels, so it is done with the high-dispersion resampled image (SI). A representative high-dispersion SI given in Figure A.1 shows echelle orders running horizontally and the spatial (cross-dispersion) direction running vertically. We will refer hereafter to the image sectors at the top and bottom as the ``ends" of the image. The BCKGRD module produces smoothed background flux spectra which, together with the gross spectra, form the net spectra. The background model is created by computing continuous Chebyshev polynomial functions from pixels that sample valid background fluxes. For images with no continuum, the algorithm proceeds straightforwardly by sampling the neighboring interorder fluxes for each spectral order and fitting the result to a Chebyshev polynomial. The BCKGRD algorithm models the backgrounds of images having continuum flux in two one-dimensional passes, as described below.
For continuum source images, the background determination algorithm
begins by sampling fluxes along the spatial direction with an extraction
slit 5 pixels tall. We refer to these cuts as ``swaths" and the steps
taken for this group of vertical swaths as ``Pass 1" operations. A total
of 25 parallel swaths (26 for SWP) are taken in the spatial direction,
each located at a column position ![]() 27 pixels larger than the
preceding swath. Figure A.1 shows the positions of these Pass 1
swaths as dotted vertical lines. The mean flux is computed along the
extraction slit from pixels containing valid local background fluxes;
pixels are given a weight of zero if they fall along the spectral orders
or if they do not contain valid fluxes (i.e., they have negative
27 pixels larger than the
preceding swath. Figure A.1 shows the positions of these Pass 1
swaths as dotted vertical lines. The mean flux is computed along the
extraction slit from pixels containing valid local background fluxes;
pixels are given a weight of zero if they fall along the spectral orders
or if they do not contain valid fluxes (i.e., they have negative
![]() flags). The result of this process is a background-flux array for
each swath that is discontinuous in spatial pixel number and contains
noise. The array is adjusted to account for interorder contamination
using a Point Spread Function (PSF) modeling technique described in
Section A.2.2. The adjusted array is fit to a trial Chebyshev function
of degree 7. This fitting degree is decreased if ringing is detected in
the initial solution. The resulting solution is a smoothed continuous
fit to the raw background fluxes. Each of the Pass 1 swaths is fit to a
Chebyshev polynomial array in the same fashion.
flags). The result of this process is a background-flux array for
each swath that is discontinuous in spatial pixel number and contains
noise. The array is adjusted to account for interorder contamination
using a Point Spread Function (PSF) modeling technique described in
Section A.2.2. The adjusted array is fit to a trial Chebyshev function
of degree 7. This fitting degree is decreased if ringing is detected in
the initial solution. The resulting solution is a smoothed continuous
fit to the raw background fluxes. Each of the Pass 1 swaths is fit to a
Chebyshev polynomial array in the same fashion.
In the second pass (Pass 2) solutions from Pass 1 are used to form a second and final set of 7th degree Chebyshev functions which model the background fluxes at the positions of the echelle orders. This solution is determined by sampling the solutions from the first pass at the locations where they intersect the echelle-order locations. The echelle-order locations are represented as solid lines in Figure A.1. The computation of a Chebyshev function from this sampling interpolates a continuous array of smoothed background fluxes at each wavelength along these orders. The solution is extrapolated beyond the target edges from the last calculated value.
The final background solutions are represented in two forms. First, a background vector of 768 values is saved and written to the high-dispersion merged extracted FITS file as a separate record for each order. Second, the 7 Chebyshev coefficients, together with a magnitude scale factor and starting and ending positions are written as FITS keywords. The ``gross" spectrum may be reconstructed simply by adding the background and the net flux solutions.
 Figure A.1:
Layout of the background extraction swaths on a
sample SWP high-dispersion image. Lines running in vertical (spatial)
direction are the Pass 1 extractions. Raw fluxes are sampled along these
lines that are within the target ring and outside or between the echelle
orders. The reconstructed background solutions created in Pass 2 are
placed in the positions of the echelle orders (horizontal lines).