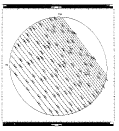
 Figure 2.1: LWP small-aperture high-dispersion (even orders)format.
Each raw IUE image consists of a 768 ×768 picture elements or ``pixels''. Partial-read images, which are not full 768 ×768 images, are discussed in Chapter 4.3. Each vidicon scan line consists of 768 pixels or ``samples'' obtained in minor frame units of 96 pixels; 768 such scan lines compose the entire image. Line 1, sample 1 is at the upper left corner of the image; line 768, sample 768 is at the lower right corner of the image. Each raw pixel value lies in the range 0 to 255 (integers only). The units of raw pixel values are data numbers (DN), which are proportional (up to the telemetry system limit of 255) to the integrated charge read out from the SEC Vidicon target in the camera scanning process. Since the telemetry system saturates at 255, the DN/charge proportionality breaks down at that level.
Associated with each raw image is a set of 20 header, or label, records. Each record is 360 8-bit bytes long and is a concatenation of five 72-byte logical records. This set of 20 label records was generated by the IUE Operations Control Center (IUEOCC) software during image acquisition and contains various identifying parameters and scientific/engineering data pertinent to the image.
Raw IUE images must be corrected for the instrumental effects of the SEC Vidicon camera system before quantitatively meaningful data can be extracted from them. The correction for radiometeric (photometeric) non-linearities and non-uniformities is discussed in Chapter 6. The removal of geometric distortions introduced by the vidicon system are described in Chapter 7. The layout of the spectral format in either dispersion mode is mathematically set forth by the methods related in Chapter 8. Figures 2.1 through 2.15 illustrate schematically the spectral formats in both dispersion modes, for both apertures, for all three operational cameras and refer to raw image space. The square border defines the 768 ×768 the whole image, whereas the inscribed arcs roughly define the target ring, which is the area within which the photometeric correction is applied (Chapter 6) and from which spectral information is extracted. For high dispersion, the extracted odd and even echelle orders are shown in separate figures. Numbers and tick marks mark the wavelengths in Å ngstroms.
 Figure 2.1: LWP small-aperture high-dispersion (even orders)format.
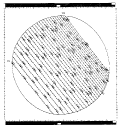 Figure 2.2: LWP small-aperture high-dispersion (odd orders)
format.
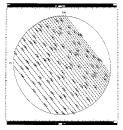 Figure 2.3: LWP large-aperture high-dispersion (even orders)
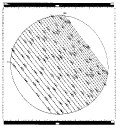 Figure 2.4: LWP large-aperture high-dispersion (odd orders)
format.
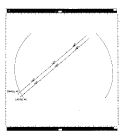 Figure 2.5: LWP large- and small-aperture low-dispersion format.
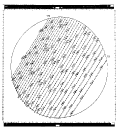 Figure 2.6: LWR small-aperture high-dispersion (even orders)
format.
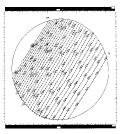 Figure 2.7: LWR small-aperture high-dispersion (odd orders)
format.
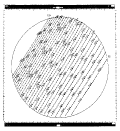 Figure 2.8: LWR large-aperture high-dispersion (even orders) format.
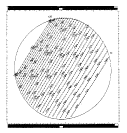 Figure 2.9: LWR large-aperture high-dispersion (odd orders)
format.
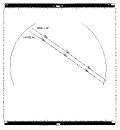 Figure 2.10: LWR large- and small-aperture low-dispersion form
at.
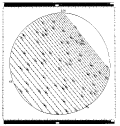 Figure2.11: SWP small-aperture high-dispersion (even orders
)
format.
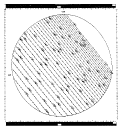 Figure 2.12: SWP small-aperture high-dispersion (odd orders)
format.
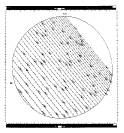 Figure 2.13: SWP large-aperture high-dispersion (even
orders) format.
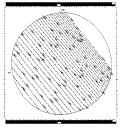 Figure 2.14: SWP large-aperture high-dispersion (odd
orders)
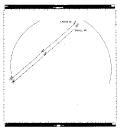 Figure 2.15: SWP large- and small-aperture low-dispersion
format.