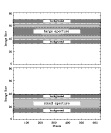
 Figure 9.1:
Locations of the extraction and background fitting
regions within the low-dispersion SI.
The background flux that is present in IUE images is composed of contributions from several sources, including the null pedestal, particle radiation, radioactive decays within the detector phosphor, halation within the UV converter, background skylight, and scattered light. The integrated effect of the last three sources varies in a complicated manner across the target depending on the spectral flux distribution of the object observed, whereas the general radiation and null components vary slowly across the vidicon tube. In practice, the average background flux in the low-dispersion SI is computed within two regions on either side of the spectrum and this average flux as a function of wavelength is fitted with a sixth-order Chebyshev polynomial.
The two background regions that are examined are each 7 pixels wide and,
for large-aperture data, begin at a distance of 13 pixels from the
predicted center location of the spectrum. For small-aperture data the
two regions begin at a distance of 8 pixels from the center of the
spectrum (see Figure 9.1).
 Figure 9.1:
Locations of the extraction and background fitting
regions within the low-dispersion SI.
The narrow large-aperture extraction
region corresponds to the 13-pixel point source slit height, while the
broad region is the 23-pixel extended, trailed, multiple, and flat-field
source slit height. The entire wavelength space of the low-dispersion SI
is included in the analysis. Before calculating the average flux as a
function of wavelength for each of the two regions, each spatial image
line within the two regions is examined individually in order to
identify flagged pixels. The FN values of flagged pixels are temporarily
replaced with the FN value of the closest unflagged pixel. Telemetry
dropouts in the background regions are identified during this process
and ![]() flag values of -4 are set in the output 1-D flag spectrum as
well as retroactively set in the 2-D low-dispersion resampled flag
image. This flag replaces the original value of -8192.
flag values of -4 are set in the output 1-D flag spectrum as
well as retroactively set in the 2-D low-dispersion resampled flag
image. This flag replaces the original value of -8192.
At this point a difference spectrum is computed from the average FN as a
function of wavelength for each of the two background regions. This
difference spectrum is used to detect the presence of cosmic ray hits
that may occur in either of the two regions. The Chebyshev polynomial
that will be fitted to the background data is sensitive to broad
features such as grazing cosmic ray hits. Since we are only concerned
with relatively broad features, the difference spectrum is smoothed with
a 7 pixel wide boxcar function. The mean and standard deviation of the
smoothed difference spectrum is then computed and any pixel locations
that deviate by more than 2![]() from the mean have their weights for
the polynomial fitting step set to zero. All remaining good pixel
locations are given equal non-zero weights in the polynomial fit. Pixel
locations that are beyond the long-wavelength edge of the camera target
area are also excluded from the polynomial fit. Once the Chebyshev fit
has been calculated, the values in the 1-D background
spectrum that correspond to locations outside the camera target area are
replaced with the fitted value of the last valid pixel.
from the mean have their weights for
the polynomial fitting step set to zero. All remaining good pixel
locations are given equal non-zero weights in the polynomial fit. Pixel
locations that are beyond the long-wavelength edge of the camera target
area are also excluded from the polynomial fit. Once the Chebyshev fit
has been calculated, the values in the 1-D background
spectrum that correspond to locations outside the camera target area are
replaced with the fitted value of the last valid pixel.