To combine our data in a way that recognized the wide variations in signal quality, we added together in separate batches the uncorrected images and their accompanying sensitivity templates, always working in a reference frame tied to fixed points in the echelle pattern. Generally, the net template created in this fashion was a fuzzy version of the pattern shown in Fig. 7. Only after all the additions had been done would we take the net uncorrected spectrum and divide it by the net template. Even then, we did not discard the net uncorrected image or its template counterpart, because this 2-dimensional information was needed to carry out an optimal extraction of an order to produce the best spectrum (§7.10).
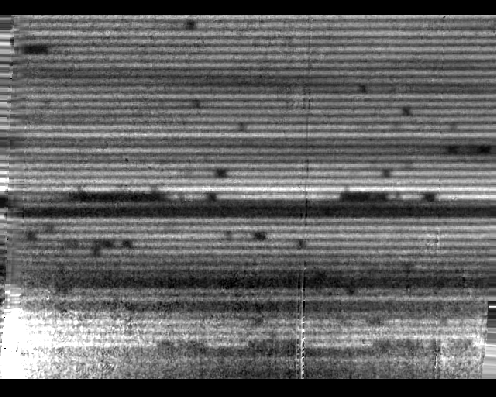
| Figure 11: A combination of 4 exposures in a group obtained by adding the images without corrections for photocathode sensitivity variations, doing a similar addition for the correction templates (in a reference frame of the spectral image, rather than the photocathode's coordinates), and then dividing the former by the latter. For ease in extraction (§7.10), the orders are artificially made to be horizontal and equidistant. |
 |
Bad pixels and columns in the CCD (§7.4) and the relatively rare data dropouts(§7.8) were assigned infinite errors by forcing their template numbers and intensities to equal zero. Thus, when these bad data were combined with the rest, their respective weights were zero. Deflections of the image by the Earth's magnetic field (§7.5) insured that co-added exposures rarely had pixels with no useful information.