|
|||||||||||||||||||
|
|
|||||||||||||||||||
TRAPPIST-1 |
 |
| This artist's concept shows what the TRAPPIST-1 planetary system may look like, based on available data about the planets’ diameters, masses and distances from the host star. Credit: NASA-JPL/Caltech | |
The raw cadence data for the K2 observations of the TRAPPIST-1 system are now available.
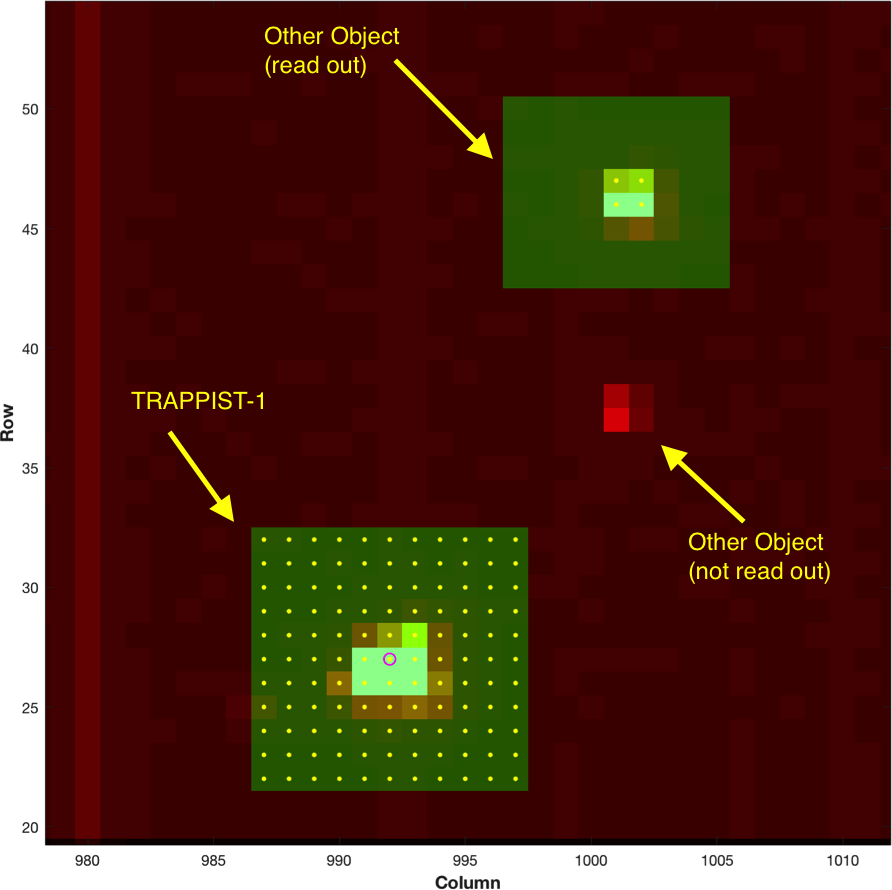
The calibrated Light Curves and Target Pixel Files should arrive some time in June, and will have K2 IDs 200164267 and 246199087, both observed in short cadence. The K2 ID 200164267 is an 11x11 pixel custom mask, while K2 ID 246199087 is a smaller, standard-sized mask, for which the project will produce calibrated products. The smaller 246199087 mask is a subset of the 200164267 11x11 mask. As such, users who want to create their own light curves for TRAPPIST-1 using custom apertures are advised to download the data for the larger 200164267 mask.
Users may use the Python-based Kadenza software tool to extract the raw data. The README file at github is also a good source for understanding the content of these files. The Format Information for Cadence Pixel Files document describes both the raw cadence data and the associated pixel mapping reference files.
An "unofficial" set of TRAPPIST-1 Target Pixel Files (TPF) have been provided by Geert Barensten, which will compress all the raw cadence data into one file. The TPF is a time series of images in a binary FITS table, where each image (roughly 11x11 pixels) represents a single cadence.
-
Download the unofficial, "pseudo-TPF" file, created by Geert Barensten:
Long Cadence | Short Cadence
Important warnings and caveats can be found at this K2 Mission Office blog post. -
Download all the raw K2 Campaign 12 data here:
https://archive.stsci.edu/missions/k2/c12_raw_cadence_data/ -
Download the corresponding Pixel Mapping Reference Files (PMRFs) at:
https://archive.stsci.edu/missions/k2/pmrfs/c12 -
Search the Portal for all available MAST data of TRAPPIST-1.
-
The community has made iPython notebooks available that show how to analyze the TRAPPIST1 raw data release.
- Tom Barclay has created an iPython notebook that demonstrates how to create a quicklook light curve using the pseudo-TPF file.
- Jim Davenport has created an iPython notebook that demonstrates how to search for flares using the short cadence pseudo-TPF file. Includes an initial plot of flare rate as a function of duration!
- Benjamin Pope has created an iPython notebook that demonstrates how to create quick-look short and long cadence light curves.
- Rodrigo Luger has created an iPython notebook that includes the software needed to reproduce the results in their submitted Nature Astronomy paper, as well as the detrended data products.
- Discuss transit times, durations, or other exciting findings with the community in the comments below.
|
|
|


 Follow Us