

Extraction of the spectra
The extraction of the spectra from the grism images is a multi-stage process which involves various software packages at different steps of the reduction procedure. The main steps of the reduction procedure are:
- standard CALACS pipeline reduction
- cosmic ray detection and sky background removal
- extraction of the 2D spectra from the individual images
- drizzling of the 2D spectral images to coadded images with a common wavelength scale
- 1D extraction of the spectra from the drizzled coadded images
- creation of the previews
Standard Pipeline Reduction
The raw images were processed with the CALACS standard pipeline.
Cosmic Ray Detection and Background Subtraction
To flag the cosmic rays, the stsdas/multidrizzle task was run on the _flt files using the default configuration. As a by-product multidrizzle detects cosmic rays on each image and flags those pixels. Mask files of the flagged pixels were transferred to the data quality extension of the corresponding _flt file. The cosmic ray affected pixels are excluded from the final spectral extraction. The information about flagged pixels is consistently transported through the whole reduction process to create weight maps for the 2D drizzled images, which serve as an input for the weighting scheme applied.
To perform a global background subtraction on each grism image,
a master sky image was constructed from a combination of all
ACS HRC Parallels grism images from the UDF and GOODS programmes.
The 864 grism images taken in those two projects represent the
vast majority of all grism images taken with the HRC to date.
The master sky image was computed with a two step image combination
procedure to eliminate object spectra and to derive a high
signal-to-noise image of the sky background.
Additional information concerning the master sky is available on
request.
Extraction of the 2D Spectra from the Individual Images
The 2D spectra were extracted from the individual images using the aXe spectral extraction software. This software package was specifically designed to handle large format spectroscopic slitless images such as from the ACS.
In order to extract the object spectra, the UDF HRC F555W catalogue was used together with a list of objects from the GOODS CDFS catalogue. The GOODS sources were included in the extraction list either if they were not found in the (shallower) UDF HRC F555W image, or only part of their first spectral order (but not their direct image) fell in the area covered by the UDF HRC data (see also Goods based Reduction).
Following the normal aXe procedure, subcatalogues were created for each
of the F555W direct images and paired each grism image with a suitable
direct image to extract the so called
Then aXe tasks newly developed for the drizzle extension of the
aXe software were used to create grism stamp images as input for the
procedure described in the next section.
Drizzling of the Stamp Images to Coadded Images
One way to derive the coadded spectrum of an object from several grism images is to extract the object spectrum from each image individually and then coadd the single 1D spectra to a combined, deep spectrum.
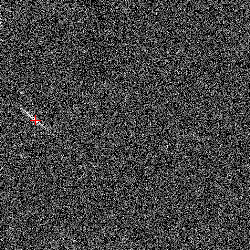
Figure 1
For the UDF HRC grism data, a reduction scheme was developed that forms a coadded, deep 2D spectral image from all the spectra in the individual images and then extracts a single spectrum from that 2D spectral image. This reduction scheme has several advantages, e.g. it allows the correct treatment of cosmic rays and has enhanced flexibility in the combination of sampled data.
To illustrate this process we show in Fig. 1
the grism image j8m840bwq_flt and in Fig. 2 the stamp image for object
J033253.28-274934.8 (ID003, epoch-1; marked with the cross in Fig. 1)
as derived from that _flt image with the aXe
procedure described above.
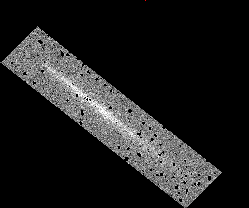
Figure 2
The transformation coefficients are computed such that the combined drizzle images resemble a long slit spectrum with the dispersion direction parallel to the x-axis, a constant wavelength scale, and the cross-dispersion direction perpendicular to the dispersion direction. For the ACS HRC Parallels the wavelength scale was chosen to be 24A/pixel, which is close to the average of the position varying dispersion of the first order spectra over the HRC field. This new reduction scheme applied to the ACS HRC Parallels will form the main part of the extensions to the aXe-package which will be released as aXe-1.4 in summer 2004.

Figure 3
Extraction of the Deep Spectra from the Drizzled Images
For the extraction of the 1D spectra from the 2D drizzled images we applied a weighting scheme to take into account the variations in signal-to-noise ratio. Those variations are a consequence of the variations in the exposure time within a 2D drizzled image which are created by cosmic rays and the irregular coverage of the total field of view by the sum of the individual images. Within each set of pixels that is coadded to a final resolution element, the weight assigned to an individual pixel is proportional to its relative exposure time. The 1D extraction was done using the existing aXe tasks and an adapted configuration that takes into account the modified spectrum of the drizzled images. The extraction width is three times the object width (which is determined by SExtractor) projected onto the extraction direction.

Figure 4
Creation of the preview
To finally create the previews for the Epoch-1/ 2 or GOODS Epoch-1/ 2 object catalogues we used the aXe visualization tool aXe2web. This additional task to the aXe package takes the input catalogue and the aXe output files and produces an html summary. In this summary each object shows as a table line the main object parameters, direct object and spectrum stamp images as well as the 1D extracted images in counts and in flux units. An overview and index pages accompany the object pages to facilitate the navigation within a data set. The blue dots in the spectra mark the spectral points where the contamiation flags was set in the input data. The links above lead to previews created by aXe2web for the F555W and GOODS based object catalogues for the UDF HRC Epoch 1 and 2 observations.
Comparison with GOODS Data
As a very coarse test of the HRC spectra, the fluxes were compared
with the broad-band energy distribution derived from
the GOODS CDFS imaging. We identified the Epoch-1 and Epoch-2 objects
in the r1.0z GOODS ACS catalogues and computed the flux from the
magnitudes in the F435W, F606W, F775W, F850LP filters.
The panels in Fig. 5 show the spectra derived from the ACS HRC Parallels
together with the broad band energy distribution from the
GOODS CDFS catalogue marked as red dots (click on a panel to get the full
sized figure).
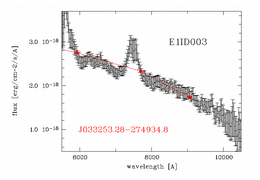
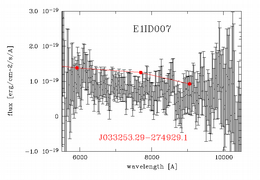
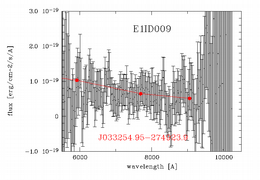
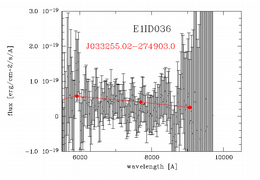
Figure 5
- Epoch-1 ID003, GOODS J033253.28-274934.8
- Epoch-1 ID007, GOODS J033253.29-274929.1
- Epoch-1 ID009, GOODS J033254.95-274923.9
- Epoch-1 ID036, GOODS J033255.02-274903.0
Remarks
Contamination flag
In contrast to conventional (slit) spectroscopy, which cuts
out small areas on the sky using slits, slitless spectroscopy
delivers many spectra over a whole field of view. This
occasionally results in the partial overlap of spectra from two
different objects. To mark those areas in the extracted object spectrum,
aXe uses the row 'CONTAM' in the spectrum tables.
This row gives an indication whether there is such a problem at the
corresponding wavelength of the spectrum. The CONTAM value in that row is
set to '1' if pixels which fall into that wavelength bin were also used
to form the extracted spectrum of other objects. In the previews
those points are marked with blue dots.
However flagged entries do not necessarily have to be discarded as bad
data. If, for example, the contaminant spectrum is derived from a fainter
object, its influence will be marginal and may be neglected.
In the case that the spectrum of a fainter object is completely dominated by
the brighter one however, then the contamination-flagged points
should be discarded from analysis. To estimate whether a reported
contamination has an effect on the spectrum or not, the spectrum
of the object must be investigated on the drizzled grism images
'h_udfhrce1g800drz_img.fits' for Epoch-1 and
'h_udfhrce2g800drz_img.fits' for Epoch-2.
We are planning to develop a more elaborate flagging scheme to deal with the
contamination issue for future versions of aXe. This scheme will then
give explicit information on the extent of damage done to a spectrum.
Notes on Individual Objects
- J033231.82-275110.6 (Epoch 2, ID137)The wavelength range of the first order spectrum of this object that falls into the area covered by the ACS HRC Parallels data is outside of the extraction range (5500-10500A). Consequently the (first order) spectrum in the data release is empty. Nevertheless the object is in the catalogue since its zero order is prominent on the drizzled grism image and contaminates the object J033231.22-275108.9 (ID127); where the offending pixels are flagged.