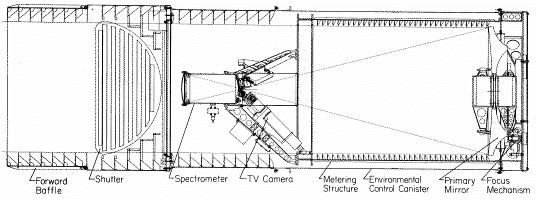
Figure 1: --- Drawing of the Hopkins Ultraviolet Telescope (plan view). Overall dimensions are
 (diameter). Many of the principal components are labeled. Power supplies, computers, etc. are located in a separate electronics module, not shown.


Figure 1: ---
Drawing of the Hopkins Ultraviolet Telescope (plan view). Overall dimensions are  (diameter). Many of the principal components are labeled. Power supplies, computers, etc. are located in a separate electronics module, not shown.

Figure 2: ---
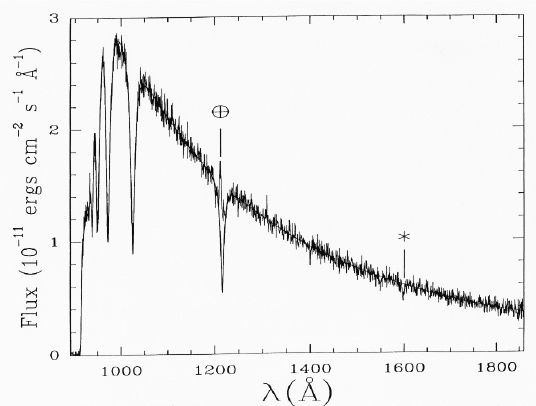
Observed (raw) count spectrum for a 366 s observation of the DA white dwarf G191-B2B. Pixels, 0.51 Å wide, have been converted to a wavelength scale. The Lyman-series lines are seen clearly. Lyman- is partially filled in by geocoronal emission. The Lyman edge produced by interstellar hydrogen is also evident. The apparent absorption feature at 1600 Å, marked with an asterisk, is an artifact, due to a small dead spot on the detector.

Figure 3: ---
Effective area of HUT in first order, obtained by correcting the data of
Figure 2 for various effects ( see text) and dividing
by a model atmosphere for G191-B2B provided by P. Bergeron.
The apparent emission features are at the wavelengths of
Lyman- , Lyman-
 , and Lyman-
 .
The smooth curve, used to generate flux-calibrated spectra from HUT data,
was obtained by smoothing the data with a Gaussian, after eliminating
the regions in the cores of the Lyman lines and near the detector artifact
at 1600 Å ( see text). The plotted points ( diamonds)
represent predicted values of the effective area based on preflight
laboratory measurements of HUT components. A representative error bar is also
shown. The two low points at 1280 and 1336 Å are suspect, due to inadequate
cross-calibration of the laboratory reference detector (at these wavelengths
only). The overall agreement is excellent, allowing for the long interval
between the measurements, and the expected slow decay of the photocathode
sensitivity.

Figure 4: ---
Adopted flux spectrum of G191-B2B.
The smooth curve is the Bergeron model calculation
( K,
K,  ) with attenuation
by interstellar hydrogen with
 cm
cm and
and  (Kimble et al. 1993).
The model has been smoothed to match the HUT resolution.

Figure 5: ---
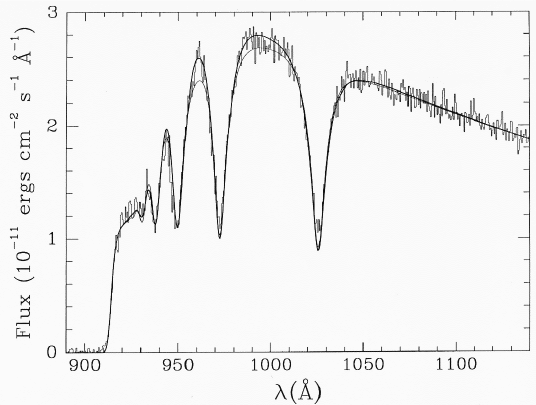
Expanded view of sub-Lyman- spectrum of G191-B2B. The heavy solid line is the Bergeron model, while the light line is from a calculation for the same
  and
and  provided by D. Koester. The model has been smoothed to match the HUT resolution.


