The HUT flux calibration for Astro-1 is based upon pre-flight and post-flight laboratory calibrations directly traceable to NIST standards, and upon in-flight observations of the hot white dwarfs G191-B2B and HZ 43. This combination of calibrations and cross-checks makes HUT the best calibrated instrument for far-ultraviolet astronomy yet flown.
The effective area curve for HUT is directly based on a white dwarf model
atmosphere for G191-B2B as described by Davidsen et al. (1992) and
Kimble et al. (1993).
The raw data from the 366 s observation of G191-B2B were corrected for
pulse persistence, dark counts, scattered light, dead time, and second-order
and third-order light as described in the previous sections.
The model atmosphere calculation is described by Holberg et al. (1991), and it
assumes
Teff=59250 K,
log g = 7.5, and V = 11.78.
The model is multiplied by the transmission function of the local ISM for
NH = 1.7 × 1018 cm-2 and b = 10 km s-1, and
smoothed to the HUT resolution. Division of this model into the corrected
count rate spectrum yields the effective area curve for the half-aperture
door state used for the observation. The correction to the full
aperture curve shown in Figure 4-4 (a) was made by multiplying by the ratio of
full-aperture to half-aperture sensitivity, derived separately from observations
of several stars that were observed in both half-aperture and full-aperture
modes.
Structure on scales less than 25 Å in the curve was removed by smoothing
the raw curve with a Gaussian of dispersion 10 Å.
Before smoothing, 5 Å regions surrounding the cores of Ly![]() , Ly
, Ly![]() ,Ly
,Ly![]() , and the 1600 Å feature were replaced by linear interpolation of
the surrounding pixels. A 15 Å region centered on Ly
, and the 1600 Å feature were replaced by linear interpolation of
the surrounding pixels. A 15 Å region centered on Ly![]() was similarly
replaced.
To obtain the effective-area curve shortward of 920 Å, where the observed flux
of G191-B2B goes to zero, we have used pre-flight calibration points at
835, 879, and 920 Å. A linear least-squares fit was made to these points and
scaled down (by 27%) to join smoothly onto the in-flight calibration curve at
920 Å.
was similarly
replaced.
To obtain the effective-area curve shortward of 920 Å, where the observed flux
of G191-B2B goes to zero, we have used pre-flight calibration points at
835, 879, and 920 Å. A linear least-squares fit was made to these points and
scaled down (by 27%) to join smoothly onto the in-flight calibration curve at
920 Å.
A full end-to-end laboratory calibration of
the assembled instrument was not possible within the scope of the HUT program.
The in-flight measurements run ![]() 20%-30% below the pre-flight values,
probably due to aging of the photocathode.
Our measurements of the on-board calibration lamp over time indicate a decline
in efficiency of 24%. We also measured a similar decline in sensitivity (in
both magnitude and spectral shape) over several years in the original HUT
spectrograph, which was replaced after the Challenger accident.
20%-30% below the pre-flight values,
probably due to aging of the photocathode.
Our measurements of the on-board calibration lamp over time indicate a decline
in efficiency of 24%. We also measured a similar decline in sensitivity (in
both magnitude and spectral shape) over several years in the original HUT
spectrograph, which was replaced after the Challenger accident.
The post-flight laboratory calibration of the HUT spectrograph was performed in
January 1992 at seven wavelengths distributed across our spectral range.
These effective areas are also shown in Figure 4-4 (a) as discrete points.
The ratio of the post-flight to pre-flight laboratory efficiencies is well fitted
by a smooth curve varying from ![]() 0.85 to
0.85 to ![]() 0.65 across our first-order
wavelength range. This degradation is consistent with our previous experience
as described above. The pre-flight effective area data for the full instrument
are also well
fitted by a smooth curve. The product of these two curves yields another smoothly
varying function that represents our best estimate for the in-flight efficiency
of HUT, based purely on our laboratory calibration, and traceable
to standards maintained by the National Institute of Standards and Technology.
This laboratory calibration curve matches the G191-B2B-based in-flight
calibration curve almost exactly, as shown in Figure 4-4 (a).
0.65 across our first-order
wavelength range. This degradation is consistent with our previous experience
as described above. The pre-flight effective area data for the full instrument
are also well
fitted by a smooth curve. The product of these two curves yields another smoothly
varying function that represents our best estimate for the in-flight efficiency
of HUT, based purely on our laboratory calibration, and traceable
to standards maintained by the National Institute of Standards and Technology.
This laboratory calibration curve matches the G191-B2B-based in-flight
calibration curve almost exactly, as shown in Figure 4-4 (a).
The ratio of the laboratory calibration curve to the in-flight curve [Figure 4-4 (b)] has a mean value of 1.003 with an rms deviation of 6.6%, and maximum deviations of +12% and -8%. We emphasize that no re-scaling has been done to achieve this impressive agreement. These results provide powerful confirmation that (1) there are no significant systematic errors in the HUT flux calibration, and (2) the G191-B2B model atmosphere calculations provide an excellent flux standard for the far ultraviolet. We believe our observation of G191-B2B constitutes the best existing absolute UV flux measurement (i.e., directly traceable to laboratory standards) of a star that is suitable as a primary flux standard throughout the vacuum ultraviolet region of the spectrum, all the way to the Lyman limit.
Comparison of the Bergeron model to
an independent model calculation for the same ![]() and
and ![]() ,kindly provided by D. Koester, shows differences at the level of <5%.
Comparison of the data and the models gives some idea of the internal
consistency of the calibration, though, of course, it yields no information on
possible systematic errors in absolute flux calibration. These could arise, for
example, from deviations of the real white dwarf atmosphere from the model
atmosphere or from unknown errors in our data reduction procedure.
,kindly provided by D. Koester, shows differences at the level of <5%.
Comparison of the data and the models gives some idea of the internal
consistency of the calibration, though, of course, it yields no information on
possible systematic errors in absolute flux calibration. These could arise, for
example, from deviations of the real white dwarf atmosphere from the model
atmosphere or from unknown errors in our data reduction procedure.
Uncertainties in the G191-B2B temperature (derived
from Balmer line profiles) translate to less than 5% changes in
the model-predicted far-UV flux down to within a few Å of the Lyman
edge. Variations in the fitting procedure used to derive the effective
area curve from the observation (judgments on how smooth the curve should be) lead to only ![]() 5% excursions around the curve we
have adopted. Therefore, since the statistical precision is also
excellent, if the DA white dwarf model atmosphere is correct, the HUT
sensitivity curve is extremely well determined.
5% excursions around the curve we
have adopted. Therefore, since the statistical precision is also
excellent, if the DA white dwarf model atmosphere is correct, the HUT
sensitivity curve is extremely well determined.
Several lines of evidence support the belief that the G191-B2B
model flux is accurate to the level cited. A comparison of the
observed spectra for G191-B2B and the significantly cooler DA white
dwarf HZ43 confirms the self-consistency of the model atmospheres
employed (Kimble et al. 1993b).
Independent of white dwarf models, a preliminary analysis of
the HUT observation of the BL Lac object PKS2155-304 indicates
that, when fluxed with the G191-B2B-based calibration, the spectrum is well
fitted by a power-law all the way to the Lyman limit, as expected for this
object. Finally, the ratio of the in-flight to pre-flight calibrations
varies with wavelength by only 20%, and this is in a manner that is
consistent with the degradation we have previously observed for
detectors of this type. There is thus no reason to suspect any large
calibration error of the magnitude that has plagued sub-Lyman-![]() spectrophotometric observations in the past (see Holberg et al. 1991
and references therein).
spectrophotometric observations in the past (see Holberg et al. 1991
and references therein).
For use in the routine reduction of HUT data, the effective area curve is
transformed into an inverse sensitivity curve
(units ![]() ) which includes the pulse
persistence correction of 0.926.
) which includes the pulse
persistence correction of 0.926.
 |
 |
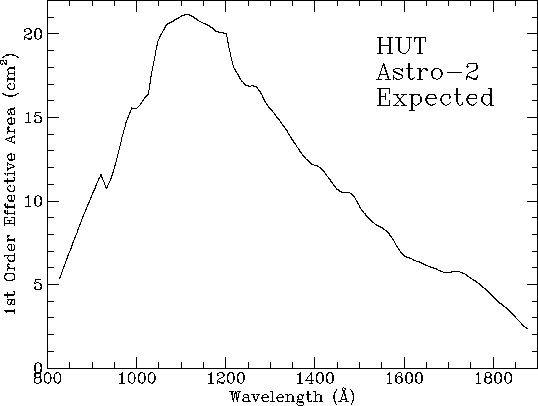
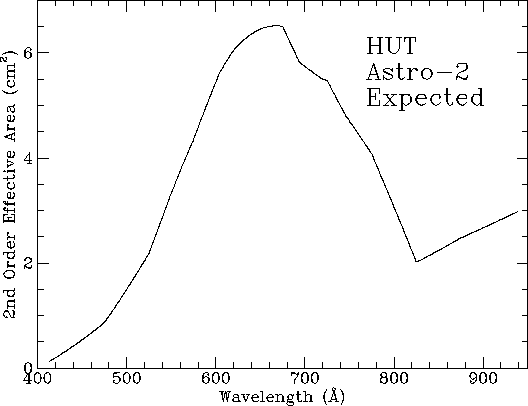
The HUT detector for the flight of Astro-1 used a cesium iodide (CsI) photocathode, the spectrograph grating was coated with osmium, and the primary mirror was coated with iridium. Each of these primary components has been improved for Astro-2 to provide approximately a factor of three overall increase in first-order effective area. The refurbished spectrograph has a silicon carbide (SiC) coating on the grating. The Astro-2 detector also has a fresh CsI photocathode. These two improvements represent a net gain of about 50% in efficiency for the spectrograph and detector system in first order. The flight mirror from Astro-1 has been replaced with the backup mirror, which we have coated with SiC for another factor of two gain in first-order throughput.
The new spectrograph and detector system have been calibrated in the laboratory
in our facilities at JHU as well as in the synchrotron beam at SURF.
The reflectivity of the newly coated mirror has also been measured
in the lab here at JHU and at GSFC.
Based on these laboratory calibrations, and including an allowance for
degradation of the photocathode efficiency similar to what was seen for Astro-1,
we derive the effective area curves shown in Figures
4-5, 4-6, and 4-7.
First order effective area peaks near 1200 Å at ![]() , and
the anticipated effective area for Astro-2 is higher at all wavelengths
than the peak effective area for Astro-1.
, and
the anticipated effective area for Astro-2 is higher at all wavelengths
than the peak effective area for Astro-1.