The FUSE instrument was focused pre-flight with the provision for in-flight focus adjustments for the mirrors and FPAs. On-orbit focus adjustments were expected due to (1) the unavailability of a full-aperture laboratory FUV source with a light beam collimated to one arcsecond accuracy and (2) the anticipated focus changes associated with gravity release and changes in the positions of the optical elements resulting from moisture desorption from the optical bench structure.
The on-orbit instrument focus procedure was a two-step process. First, the telescope was focused by adjusting the mirror to FPA distance for each channel. Then each spectrograph was focused by adjusting the distance from the telescope mirror to the spectrograph grating for each of the four instrument channels. The FPAs were then re-adjusted to maintain the previously determined telescope focus. There was no separate focus for the FES cameras.
The telescope focus was determined through a series of knife-edge tests performed by scanning a target across the edge of the FPA slit at a series of different FPA Z-positions. The FPA Z positions were adjusted November 24th, 1999, based on these tests. Details of the motions are given in Section 6.6.1 and Table 6.6‑1.
Two programs were executed to determine the spectrograph focus. The first of these programs, I817, was executed during the December 7 December 9, 1999 time interval. Multiple stellar spectra of HD208440 were acquired through the LWRS aperture for each of 5 mirror positions, which were stepped in 150 micron increments along the optical axis. These data were analyzed to determine the mirror position that yielded the sharpest spectral absorption features. The resulting adjustments to the miror and FPA Z positions were implemented on December 12th 1999. These adjustments are discussed further in Section 6.6.1.1 and presented in Table 6.6‑2.
The signal-to-noise of the I817 data was relatively low for the SiC channels, hence a second spectrograph focus test was executed two months later as part of program I819. The quality of the resulting data was significantly better in all four channels, leading to a final focus adjustment on March 16th, 2000. The adjustments are tabulated in Table 6.6‑3.
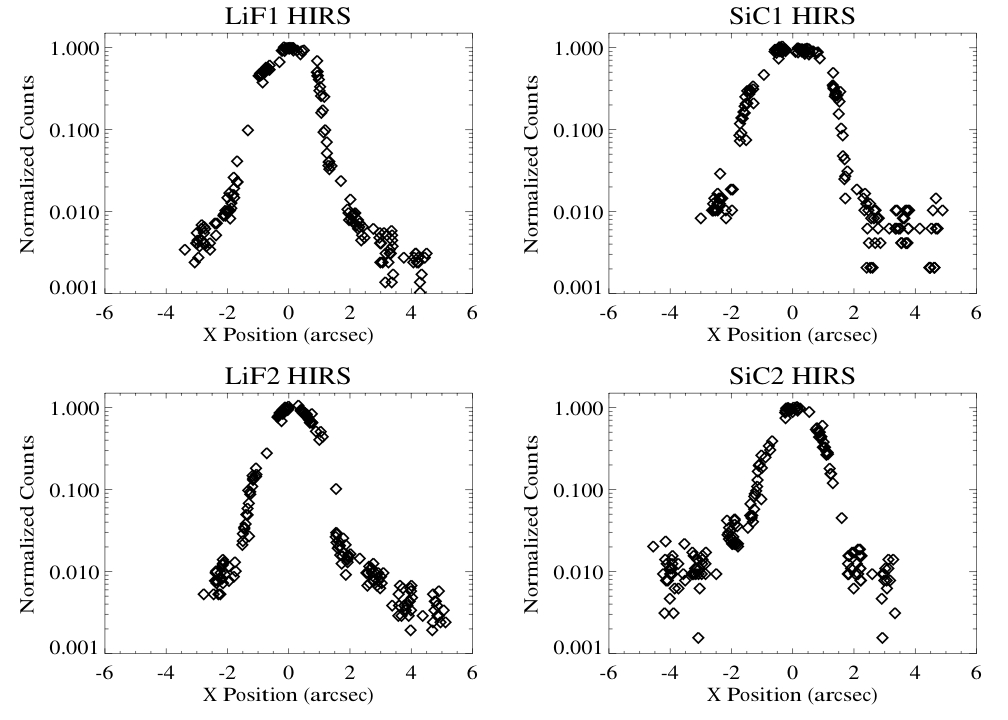
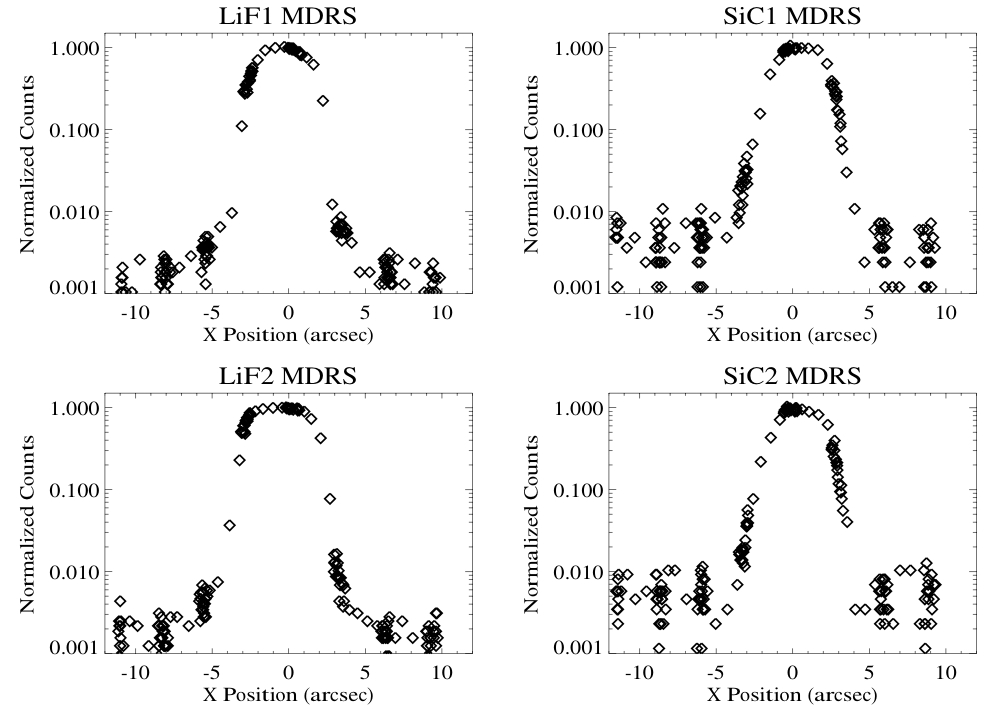
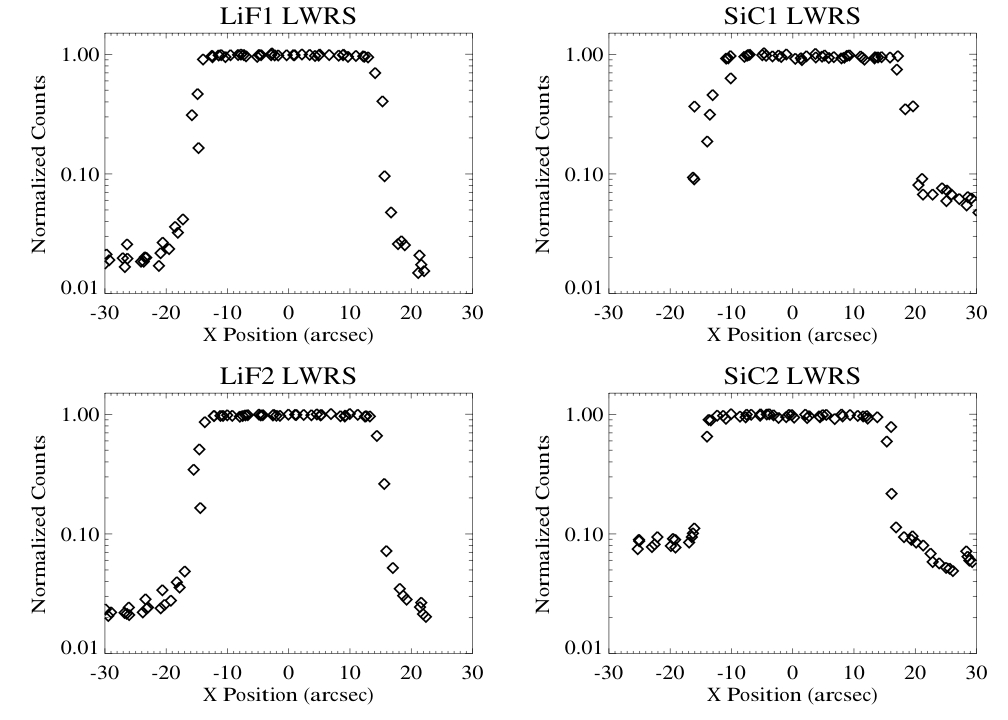
The tails of the telescope PSF after the final focus were evaluated by a retrospective analysis of the peakup and alignment scan data. The peakup procedure produced count-rate measurements for a small range of offsets from the PSF peak, and the alignment scans produced measurements of count rates for a larger range of offsets, but typically with fewer samples at any given offset. The peakup procedure and sample data are described in Section 4.2.2, and the channel alignment procedure and sample data are provided in Section 6.7.4. The results of this analysis are show plotted in Figure 4-1, Figure 4-2, and Figure 4-3, for the HIRS, MDRS, and LWRS apertures, respectively.
Figure 4-1: The log of the count rate, normalized to unity, is shown plotted as a function of the X-position of a point-source image relative to the center of the HIRS aperture in each channel. This is equivalent to the convolution of the telescope PSF with the HIRS aperture.
Figure 4-2: Same as Figure 4-1 above, but for the MDRS aperture.
Following the focus adjustments made in early 2000, the throughput of the MDRS aperture was measured to be 98%, and that of the HIRS aperture was 90%. The effective throughput of the narrow apertures was quite sensitive to drifts of the channel alignment on orbital timescales, and thus varied from one exposure to another in the SiC channels and in whichever LiF channel was not in use for guiding. Throughput in the HIRS aperture was also sensitive to the accuracy of both the peakup calculation and the slew executed as the final step of the peakup procedure; mis-centering of a few tenths of an arcsecond were possible and would have a noticeable impact on the throughput. When FES-B was made the guide camera in July 2005, the LiF2 FPA was moved by 400 microns along its Z-axis (see Sections 6.2.2 and 6.4.2). This had no adverse effect on the spectral resolution of point sources, but the throughput in the LiF2 channel was reduced to ~70% for MDRS and ~15% for HIRS.
Figure 4-3: Same as Figure 4-1 above, but for the LWRS aperture.
During the
IOC period shortly after launch, it was realized that the telescope mirrors
underwent periodic motions that shifted the targets image at the telescope
focal plane and thus its spectrum in both X and Y on the
detector. A source in either of the SiC channels could move as much as 6
arcseconds in a 2 ks time interval. This motion had two effects on the data:
first, flux was lost if the source drifted (partially or completely) out of the
aperture; second, the was spectrum shifted on the detector, degrading spectral
resolution for observations using the LWRS (30 arcsecond) aperture. The procedure for the initial post-launch
channel alignment was to perform a spiral search pattern of motions on LiF2,
SiC1, and SiC2 while guiding on the target using FES-A with LiF1 and the LWRS
aperture. The FUV count rate was monitored while using the mirror actuators to
locate the target position in the three non-guide channels. This method
required use of a moderately bright FUV point source in a fairly isolated star
field to provide sufficient counts and prevent confusion from nearby field
stars. Overall, this method worked well and was used to initially align
channels to a 15-arcsec precision. Finer co-alignment was then performed by
stepping the roughly co-aligned images across the edge of the LWRS slits. The
data were analyzed to determine the mirror rotations required to remove the
measured alignment errors at that attitude for each of the three non-guiding
channels relative to the LiF1 channel. This method allowed for
co-alignment to approximately 2 arcsec. As further alignments and observations were
attempted, it was found that all of the channels were moving with respect to
each other, with misalignments as great as 40 arcsec. It was quickly realized
that the coalignment was being lost following large changes in spacecraft
attitude that changed the thermal environment of the instrument. As a result,
grouping observations by Solar beta angle and boresight-to-orbit-pole angle
became a contraint on mission planning, and channel coalignment procedures were
needed roughly weekly instead of the expected few times per year. Small misalignments of the channels could be
removed by performing peakups in either the MDRS or HIRS aperture. This
involved performing small maneuvers of the spacecraft in the X direction and
measuring the FUV counts as the target crossed the narrow axis of the slit.
Before ACS components began to fail, the pointing of the spacecraft was
dithered in a step and dwell pattern, with nine steps separated by 3 arcsec
(MDRS) or 1 arcsec (HIRS), and dwells lasting 10 seconds long at each step.
Later in the mission, when adapting to operations with a single reaction wheel
, the step and dwell sequence was replaced by a continuous scan. Photons
occurring in the LiF and SiC counter masks for each detector (Sec. ) were
accumulated. At the end of the scan, a flux-weighted positional centroid was
computed for each channel and a test was performed to verify a peak occurred in
the data: the maximum count had to be at least 5 x sqrt(mean). The
spacecraft was moved back to the position where the guiding channel (LiF1 or
LiF2) had maximum counts and the other three FPAs were moved into alignment. If
no peak was found in the guiding channel, the spacecraft was moved to the target
acquisition position. For the other channels, an absence of a peak meant the
FPA was not moved. Figure
4‑1 shows an example of the counts obtained during a peakup scan. The peakup software and FPAs were designed to
eliminate channel misalignments on the order of 5-10 arcsec in the X direction.
Similar misalignment in Y was accommodated by making the slits 20 arcsec long.
The larger errors found on-orbit impeded peakup alignments in two ways. First,
if the initial position of a target in a channel was further than the width of
the slit beyond the range of the scan, the target would likely not be found.
Secondly, if multiple peakups were scheduled during an observation or a
spurious peak were found, a motion could be computed to move an FPA past its
limit. The IDS software at launch would reject all FPA motions if any one were
out of bounds, effectively allowing one bad channel to cancel the peakup
results. After the software was changed to allow all valid FPA motions to occur,
better alignment was achieved. Other peakup problems that occurred less often
were false peaks being found due to event bursts on the detector (Section 4.4.3.3
) and peaks contaminated by other objects near to the target.
Figure 4‑4: The FUSE Image Motion was defined as the
variation of the alignment of the SiC1, LiF2, and SiC2 channels with respect to
the reference LiF1 channel used for guiding. Although these motions were
generally quantified as being associated with the non-guiding channels, they
were caused by the motions of LiF1 in combination with the other
channels. (Any LiF1 motion was corrected by the ACS using FES Fine
Pointing Data, so it appeared to remain steady.) After the switch to FES-B in
July 2005, LiF2 replaced LiF1 as the reference channel. The observed image
motion was attributed to the thermal changes induced in the instrument by changes
in boresight beta angle and orbital pole angle. The boresight beta angle
is the supplement of the angle between the satellite-sun line and the
instrument line of sight, and the orbital pole angle is the angle between the
orbit pole and the instrument line of sight. To mitigate loss of data due to channel
misalignment while retaining observing efficiency, the LWRS aperture became the
primary observing aperture for most programs. For MDRS and HIRS
observations, two peakups per orbit were executed when necessary to
maintain channel alignment during an observation and obtain full spectral
coverage while using these apertures. A two-part strategy was developed to maintain
alignment of the four mirror channels. This strategy included both a
predictive component based on empirical modeling of changes in mirror position
as a function of boresight attitude and a periodic hard re-baselining of the
alignment. Sections 6.7 through 6.7.5.1 discuss further the
procedures necessary to maintain channel alignment, its impact on observatory
efficiency, mirror motions over an orbital observing period, the analysis tools
required to maintain alignment, and mirror motion trending. CalFUSE
corrects the non-guide channels for the mirror motion on
orbital timescales using an empirically derived correction. A more
detailed discussion is presented in the the CalFUSE pipeline paper (Dixon et
al. 2007).
The resolving power of FUSE depends largely upon the residual aberrations in the
spectrographs, primarily astigmatism, and on the imaging properties of the
double-delay line MCP detectors. The detector imaging resolution is best at the
center of each segment and degrades somewhat towards either end. In addition,
fixed-pattern noise introduced by the MCPs can cause localized degradation of
the resolution
(see Sections 4.4.2, 4.4.5, 4.4.6, 4.4.7 for details).
These effects cause the resolution to vary as a function of wavelength, and with spectrograph aperture.
Variations in detector gain over the mission (Section 4.4.2)
cause some of the detector contributions to the LSF to vary as well.
Finally, the combined effects of target motion and uncertainties in the corrections for grating motion
can cause the point source resolving power of FUSE data to vary between observations and from exposure to exposure within a given observation. CalFUSE applies a corrections for these effects to each photon in the event list for TTAG data. However, histogram data cannot be corrected on photon event timescales and the 1 × 8 binning factor of histograms gives rise to a ~5-10% reduction in resolving power compared to time-tagged data. As a result, TTAG data will almost always exhibit a higher resolving power than HIST data obtained with the same aperture. The exception is long exposures of targets that are too faint to correct properly for image motion. Careful analysis of time-tagged exposures with good S/N may yield spectra with somewhat higher resolving power than the nominal value of R=20,000.
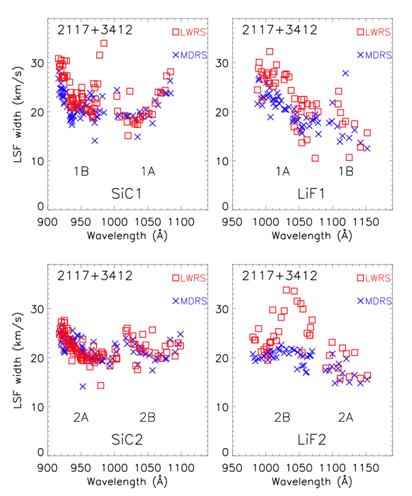
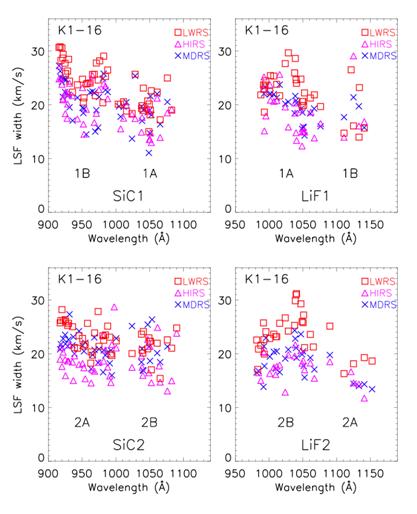
The LSF has been characterized by modeling ISM absorption along the line of sight for two representative targets: K1-16 and RX J2117+3412. The former was observed in TTAG mode for all three apertures, and the latter was observed in HIST mode through LWRS and MDRS. The data were processed with CalFUSE v.3.2.3. Spectra from each exposure were coaligned on narrow absorption features and combined. All usable exposures obtained during the FUSE mission were included. The column density and b-value were determined from profile fitting for OI, NI, FeII, and each H2 J-level observed; the b-value was also determined for HI. (Profile fits were performed using the program OWENS, developed by Martin Lemoine and the French FUSE Team.) Fits were performed independently for each channel and for the combined data set to check internal consistency, and a curve of growth analysis was performed for the H2 J=1 lines in the K1-16 spectra and for the H2 J=3 lines in the RX J2117+3412 spectra. The width of a Gaussian instrumental LSF was fit as a free parameter for each absorption line.
The results are shown in Figure 4-5 for K1-16, and in Figure 4-6 for RX J2117+3412. The LSF measurements exhibit greater scatter for K1-16 than for RX J2117+3412, because the signal to noise is lower for the K1-16 data sets, and because the IS absorption lines are generally weaker for the K1-16 line of sight. The K1-16 TTAG data do tend to show somewhat better spectral resolution than the RX J2117+3412 HIST data, but the differences are not dramatic. The K1-16 data do show a systematic trend of better resolution in HIRS than in MDRS, and in MDRS compared to LWRS. The results for the SiC channels clearly show better resolution at the midpoint of each detector segment, as expected, but the behavior in the LiF channels appears to be dominated by other effects. The LWRS LiF 2B data in particular show a dramatic decrease in resolution near the midpoint of the detector segment. The results shown here are generally consistent with the LWRS TTAG LSF measurements of Williger et al. (2005); the exception is LiF2B, for which they obtained 25 km/s at the midpoint of the segment, rising to 35 km/s at either end.
A detailed characterization of the LSF obtained from analyses of lines of sight towards white dwarfs within the Local Bubble was presented by Kruk et al. (2002) and Wood et al. (2002). They found that a two-component Gaussian LSF was needed to fit the HI Lyman series lines. A two-component LSF was not pursued in the present analysis, partly for simplicity in presenting the results, and in part because the more complex ISM and photospheric absorption spectra made it difficult to isolate the effects of two LSF components. The width of the narrow components obtained by Kruk et al (2002) and Wood et al. (2002) were similar and correspond to ~20 km/s, consistent with the single-Gaussian results presented here.
Figure 4-5: Spectral resolution measured from ISM absorption lines along the line of sight to K1-16.
There are two sources of scattered light that can add to the
background and thus compromise the instrument sensitivity: in-band scatter from
the grating itself and stray light scattered from surfaces such as the internal
spectrograph baffles or other illuminated surfaces within the spectrograph
cavity. The in-band, grating scatter was measured at the component level to be
1 × 10⁻⁵
/. This is a typical scattering number
for holographically-ruled gratings. In-flight measurements give a consistent
result: the integrated scattered light present in heavily-saturated absorption
line profiles was typicaly less than 1% of the continuum flux. This
contribution to the background scales with the intensity of the source. Stray
light differs in that it scales roughly with the overall airglow line
intensity. It is expected to be caused by geocoronal Lyman α
emission entering the spectrograph cavity
through either the FPA apertures or the vent. The distribution of the stray
light is not uniform, but shows considerable structure across the detector.
The FUSE Data Handbook (2009) Section 7.2 provides
quantitative results of the on-orbit scattered light measurements. The combination of SiC and LiF
coatings on the primary mirrors and gratings was designed to maximize the
effective area across the whole FUV band. Because the reflectivity of LiF drops
rapidly below approximately 1020 , the effective area changed significantly
with wavelength. In addition, the gaps between the detector segments
created narrow bands (typically 10 wide) where the total effective area
dropped by as much as a factor of 2. Plots of the effective areas as a function
of wavelength and time for the individual detector segments are shown in Figure
4‑7. The definition of the flux calibration and the evolution of the
sensitivity over time is discussed in further detail in
Section 7.5 of The
FUSE Data Handbook (2009).
Figure
4‑7: The in-flight derived effective area as a function of wavelength
for each detector segment. Each curve for a given detector segment represents a
snapshot of the effective area as a function of time and wavelength. The family
of curves for each segment represents the degradation of the effective area
over the eight year on-orbit lifetime of the mission. The spectra of point-source
targets often show a depression in the flux that spanned as much as 50 of the
spectrum (Figure ref). In two-dimensional detector images, these depressions
appear as narrow stripes roughly parallel to the dispersion axis. Investigations
early in the mission showed that they were highly variable as a function of
time, even within a single orbit. These stripes, known as worms because of
the way they moved during an orbit, can attenuate portions of the LWRS LiF1B
spectra by as much as 50%. Worms were due to an unfortunate
interaction between the focus of the spectrograph and the detectors quantum
efficiency grid. The optical design of the spectrograph resulted in astigmatic
images with separate sagittal and tangential focal surfaces. The detector was
placed at a location to obtain good spectral resolution, close to the sagittal
focus. At some wavelengths, the tangential focus fell close to the location of
the QE grid, which was about 6 mm in front of the detector surface, and was
curved to match the MCP curvature. The grid had 25.3 m wires spaced ~1 mm
apart, to give an open area of 95%. Since the vertical extent of the spot was
much less than the spacing between grid wires near the tangential focus, the
effect of the grid wires could be significantly magnified; close to 50% of the
light could be blocked by a single horizontal grid wire if it fell in the right
place. The complex relationship between
the position and alignment of the grid wires, the exact locations of the
optical elements, the illumination of the telescope, the pointing stability, the
wavelength of the light, and the optical design meant that only detailed models
can predict exactly what effects the grid wires were expected to produce on the
spectra. Raytrace predictions made during the mission were qualitatively
similar to what was observed. In flight, the effects of the
grid wire shadows were found to be extremely sensitive to the exact position of
the spectrum on the detector. Therefore, as the spectra moved slightly on the
detector due to grating motion, the shape and location of a worm could change
dramatically. Small displacements of the source image along the vertical axis
of the spectrograph slits could cause similar variations in the effects of a
worm. Because every object had minor coordinate errors, they would be placed at
different positions along the slits and thus might be affected differently.
Multiple observations of a given star might also have varying worm effects,
either resulting from use of different guide stars or from differing thermal
environments at different seasons. The nature of these variations depends in
part on the orientation of the grid wires. When the wires are oriented parallel
to the dispersion plane, the degree of obstruction is sensitive to the position
of the spectrum primarily at wavelengths in the vicinity of the astigmatic
correction points. For these portions of the detectors, the effects of the
worms are fairly stable and the flux calibration is reliable. In some
places, however, the grid wires are oriented at a modest angle with respect to
the dispersion plane. In these cases, vertical motion of the spectral image
causes the region being obscured to shift in wavelength space. The flux
calibration is not reliable in these cases, but fortunately the regions
affected in this manner are limited. The worm in LWRS LiF1B was by far the
strongest and most variable; for this channel, the flux calibration was defined
so as to represent the sensitivity in the absence of the worm, so that it would
always appear as absorption. The calibration for the other channels was not
adjusted in this manner, but rather was defined from the mean of numerous
observations of standard stars. The case that may have the greatest effect on
users is the worm in LWRS SiC1B, which cuts diagonally across the spectrum at
wavelengths longward of about 975 . At times when the worm is shifted towards
the midplane of the spectrum, the reported flux will be too low, but at times
when the worm is shifted further away from the midplane, the reported flux will
be too high. The flux calibration issues are discussed in more detail in
Section 7.5 of the FUSE Data Handbook. (The spectra of GD 659 in this section of the Data Handbook illustrate the case
where the SiC1B LWRS worm has shifted off of the spectrum, causing a
spuriously-high flux to be reported for the last few angstroms of the
spectrum.) While the worm was most
prominently seen in LWRS LiF1B spectra (with flux loss on the order of 50% at
some wavelengths), it was present at a lower level in most FUSE channels and
apertures. Although no systematic investigation of all worms could be made, a
large number of calibration exposures were examined in order to understand the
effects of the worm on the data. Table 4.3‑2
summarizes the results of this investigation. Table 4.3‑1: Summary of worms identified in the FUSE data.
Since the position and strength
of the worm in a given segment varied so strongly as a function of position of
the target in the aperture, there is no simple, automated way to correct for
it. As a result, worm effects remain uncorrected in the calibrated FUSE data,
and thus observers should examine their data carefully in order to assess the
effects of the worm. It should be noted that for a
uniformly filled slit the horizontal grid wires blocked a much smaller fraction
of the light, so the effect is much smaller. Thus no worms were seen in the
airglow lines.
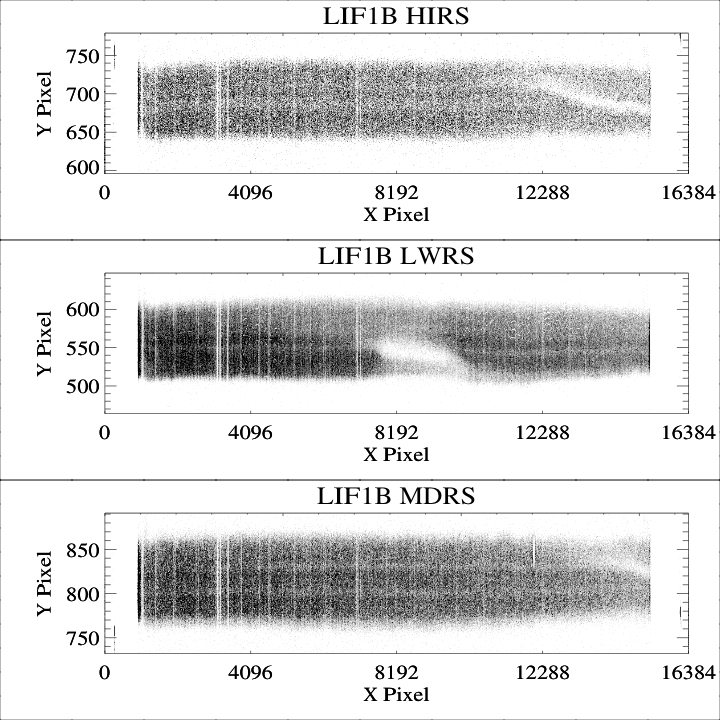
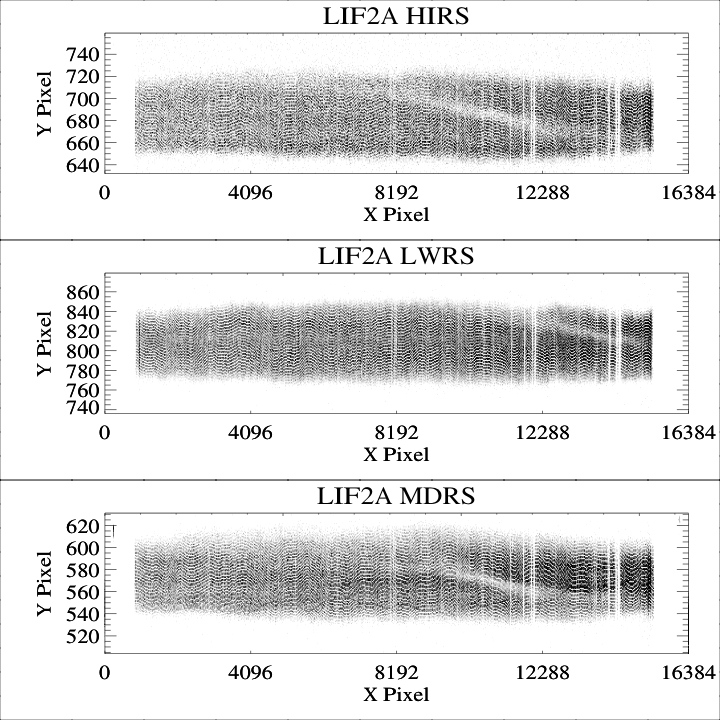
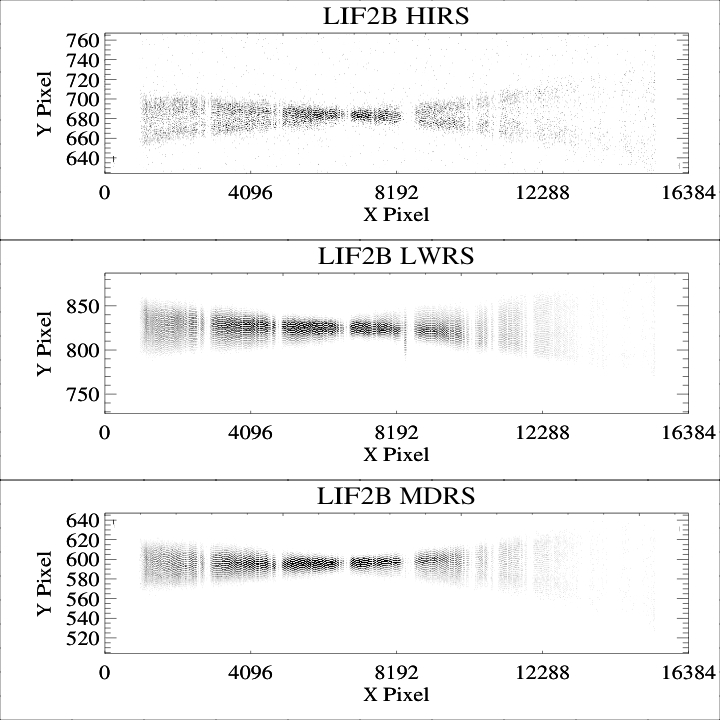
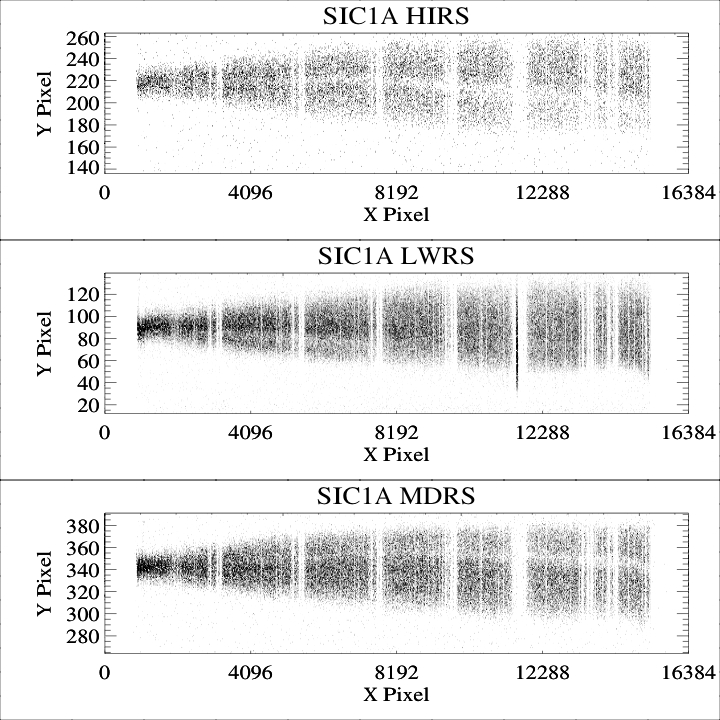
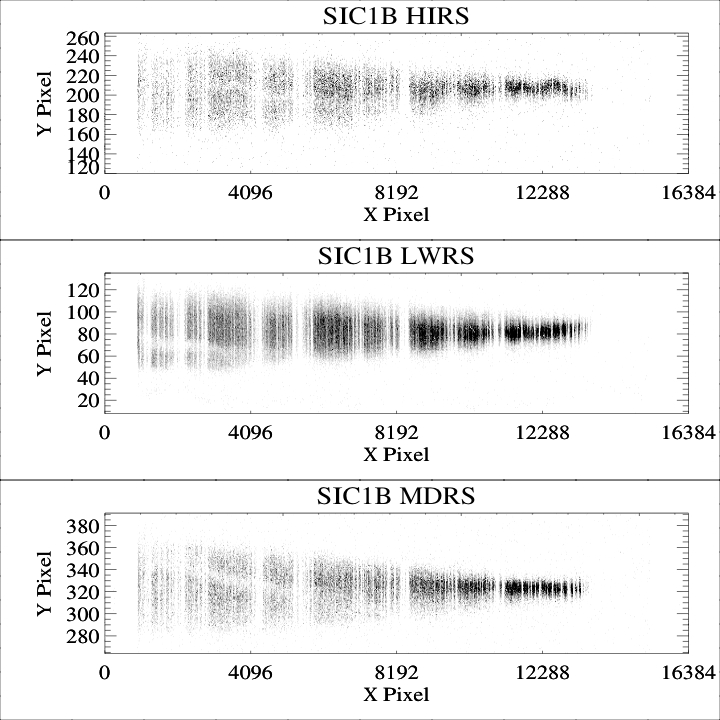
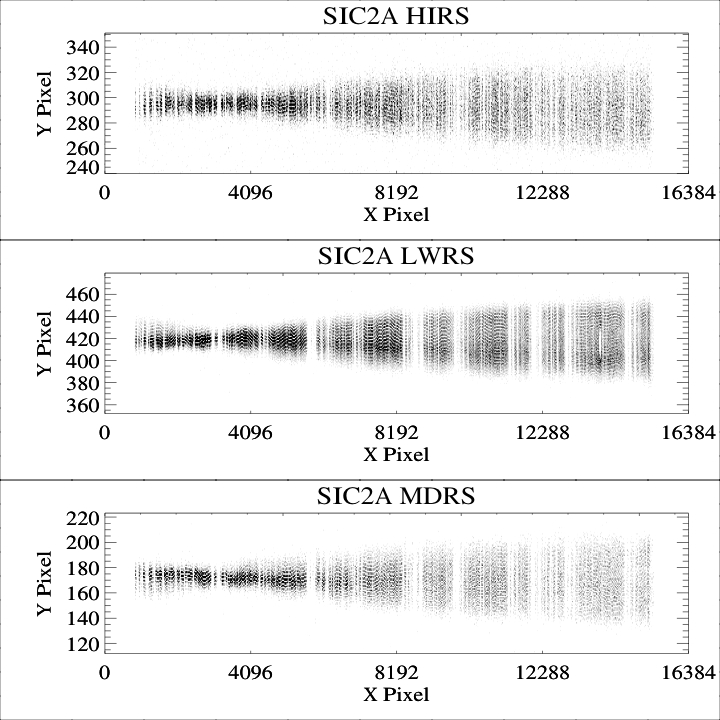
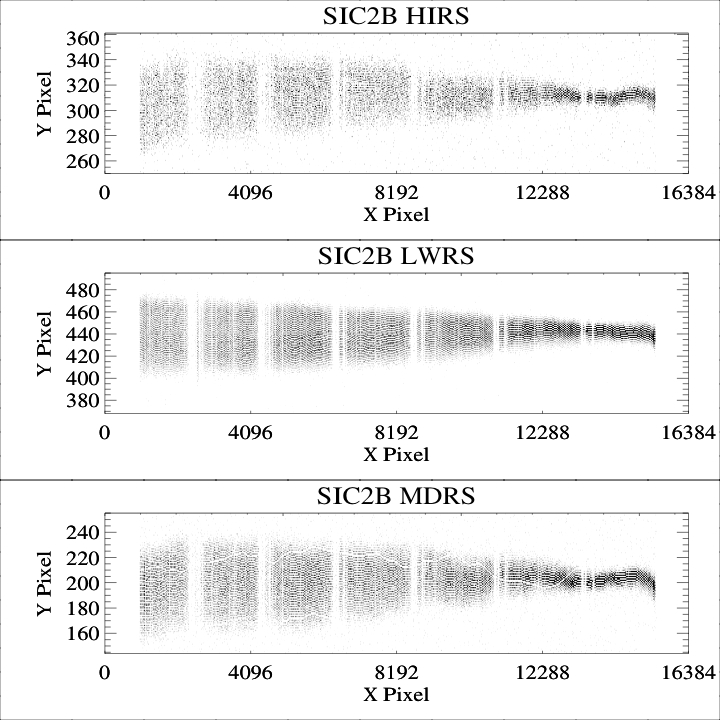
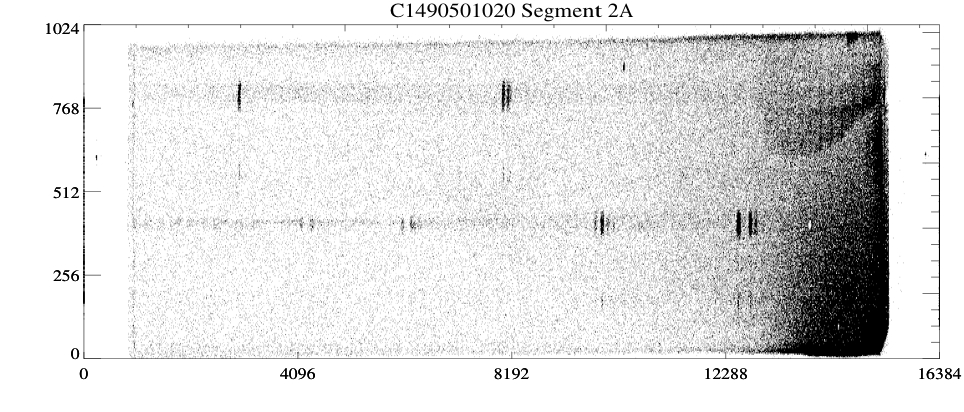
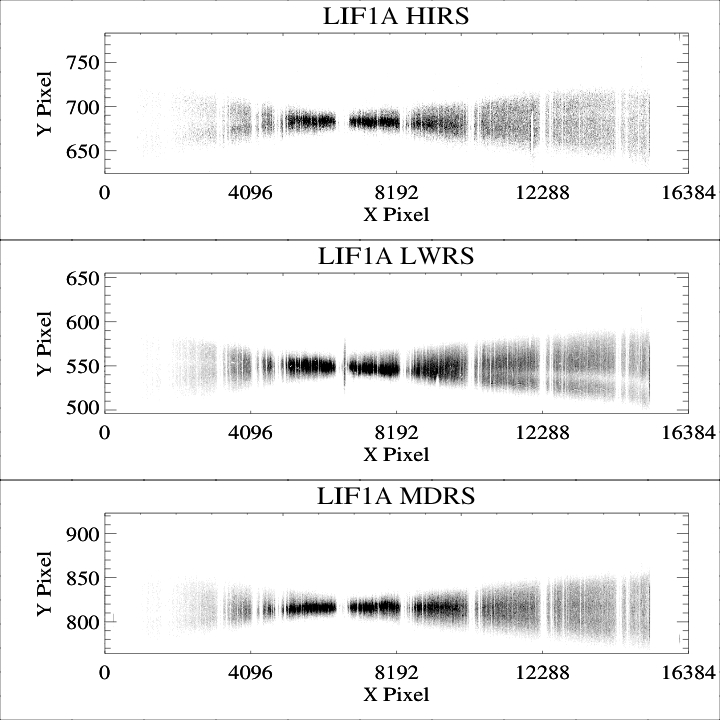
Figure 4-8: Spectral images of a stellar spectrum obtained in the LiF1 channel for each aperture are plotted for detector segment 1A. The grey scale is inverted, so that regions of high count rate appear dark. The narrow vertical lines are absorption features arising from interstellar gas, primarily H2. The broad horizontal stripes are shadows cast by the detector QE grid wires, aka the "worms".
Figure 4-9: As in Figure 4-8 above, but for LiF1B. Note the strong worm feature in the LWRS spectral image.
Figure 4-10: As in Figure 4-8 above, but for LiF2A. In addition to the worm features present in each spectral image, faint single-pixel-wide horizontal moire patterns are evident, which are an artifact of the distortion corrections.
Figure 4-11: As in Figure 4-8 above, but for LiF2B.
Figure 4-12: As in Figure 4-8 above, but for SiC1A.
Figure 4-13: As in Figure 4-8 above, but for SiC1B.
Figure 4-14: As in Figure 4-8 above, but for SiC2A.
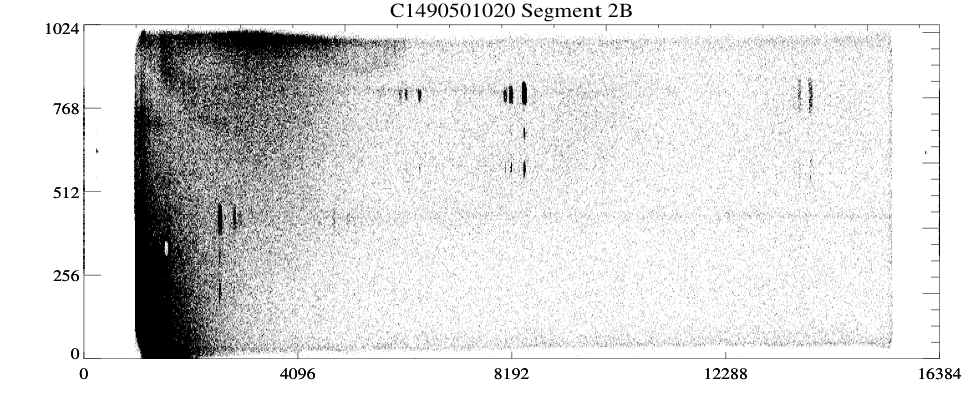
Figure 4-15: As in Figure 4-8 above, but for SiC2B. Worms are weak or not present. The very thin white jagged line running across the MDRS spectral image is an artifact from the distortion correction; some residual vertical distortion is present in the HIRS and MDRS spectral images beyond pixel 12000.
When the first exposures were taken during IOC, it was
discovered that the Lyman-β airglow
lines were moving on the detector in both the dispersion and cross-dispersion
directions as a function of time. Since the airglow emission fills the
apertures, these motions are distinct from those due to the motions of the
mirrors. Instead, they are due to small rotations of the gratings. The exact
cause of these rotations was unclear, but they were apparently due to changing
thermal conditions at the top of the instrument where the gratings were
mounted. A detailed examination of the
motion of the airglow lines as a function of various orbital parameters showed that
both the amplitude and direction of the motion were periodic. The motion
was also found to be a strong function of orbital phase and was repeatable for
a given beta angle, pole angle, and position angle. These motions shifted both the
target and airglow spectra by as much as 15 pixels (peak-to-peak) in both the X
and Y axes on the detectors. Figure 4‑16 shows an example of the variation for a
single observation. An empirical model of the motion
was derived by examining the shifts in many exposures. Early in the mission,
the limited data available led to a simplified model that was a function of
beta angle and declination, and consisted of a sum of sinusoids with periods of
one orbit for each beta and declination range. As more observations were made
at different pointings, this model was refined, and the final model was based
on all the data collected from the beginning of the mission through early
September 2006. Periodic motions on orbital, diurnal, and precessional (~60
day) timescales were identified in this data, although the final calibration
file (grat005.fit) uses only constant and orbital terms due to limitations in sky
coverage in the data. The motions and offsets were modeled as a function of
beta angle, pole angle, and position angle. Figure 4‑16: For a
single observation (S505702) the position of the LiF1A Lyman-β
airglow line on the detector is shown as a function of time. Each
point represents the average position on the detector of ~500 consecutive
airglow photons.
As shown in Figure 4‑17, the
grating motion correction can make a significant improvement in the measured
resolving power. In the example shown, each point represents the average
position of approximately 500 consecutive Lyman-β
photons in the LiF1A spectrum. Without a correction, a peak-to-peak variation
of more than 11 pixels is seen. By applying the grating motion correction, this
variation is reduced by more than a factor of two. Figure 4‑17: The same data as in Figure 4‑16 is shown both before
(top panel) and after (bottom panel) the CalFUSE grating motion correction is
applied.
The high voltage on each of the
four segments was independently controlled. At any given time, there were four
important high voltage levels on the MCPs for each segment: During normal operations the high
voltage cycled between SAA and FULL. A single command would bring the high
voltage from SAA to FULL in a few seconds. These transitions were scheduled to
occur autonomously before science exposures began. Similarly, normal FULL to
SAA transitions occurred outside of exposures. Ramping up the high voltage all
the way from HV ON to FULL, however, was done manually from the ground, since
autonomous ramp ups were never implemented. Such ramp-ups were necessary,
for example, whenever a single-event upset (SEU) (Section 6.3.4) caused a
detector reboot, or whenever a high-voltage transient, or crackle, caused an
autonomous shut down of the high voltage (Section 6.3.5). Ramping up the high
voltage from the ground was a multi-step process that could take a large
fraction of a day; it was typically done using one of two methods. Both
included a relatively quick (typically 1 to 3 orbit) ramp to SAA level. The
standard slow ramp procedure then increased the voltage in six steps up to
FULL, usually over 6 orbits. Alternatively, the fast ramp up instead involved
a wait of about six hours at SAA level followed by a single command to increase
the voltage to FULL. Early in the mission, the slow ramp-up was used
exclusively. Eventually, the fast procedure was used in order to speed up the
process, but the slow one was still used if a fast ramp up resulted in a
crackle shutdown. Because ramp-ups were done
asynchronously with the observing schedule, a significant number of
observations were taken with one or more segments at HV levels other than those
described above. The minimum and maximum high voltage levels during an exposure
are recorded in the DETnHVmL and DETnHVmH header
keywords in the data files (n=1,2; m=A,B), and the HV_FLAG notes
if the voltage is not at its nominal level. CalFUSE uses these values to
determine whether or not the voltages were within the appropriate ranges and if
the data should be excluded. High voltage as a function of time during each
exposure is also available in the hskpf.fit and Intermediate Data Files (IDFs).
By default, CalFUSE excludes data taken when the high voltage is too low. Among the most serious detector
effects impacting the science data was that of gain sag. As a MCP is exposed to
incident radiation, its ability to replenish the electrons in the MCP glass is
diminished. This effect, though nonlinear and dependent on many variables,
worsens with increased exposure. The result is that the secondary emission
coefficient drops as a function of time, so that an incident photon will no
longer produce as many electrons at the back end of the MCP stack as it once
would have. This decrease in charge is known as gain sag. A small amount of gain sag may
produce no noticeable effects on the data; the first effect is simply a shift
in the pulse height distribution to lower values. A significant drop in gain
could cause the events with the lowest pulse height to be lost below the
threshold of the sensing electronics. But before that occurs, there may be
other effects. The DDL detectors on FUSE were affected by detector walk, which
is a dependence of the calculated X position of the photon on the pulse height
of each event. Since the calculation of the incident position relies on a
timing measurement between two pulses, the shapes and sizes of the pulses can
affect this determination in an important way. One solution to the problem of
gain sag is to increase the high voltage across the MCPs, which boosts the
secondary emission coefficient. If the gain sag is not uniform across the
detector, however, raising the voltage may not completely solve the problem,
since some less-sagged regions may end up with a gain that is too high for
proper processing (Section 4.4.6.3). In addition, higher voltage
levels may cause other problems. In the case of FUSE, the incidence of crackles
sometimes increased as the high voltage was raised. In particular, the voltage
on segment 2A could not be raised above 149 digital units without the number of
crackle shutdowns increasing dramatically (section 4.4.1) Since the FUSE instrument had no
shutter, light from the sky fell on the detectors whenever the baffle doors
were open. Thus, whenever the high voltage was above SAA level and a science
target was placed in the aperture before an exposure began, or was left in the
aperture after an exposure ended, charge was extracted from the MCPs even
though the data were not being recorded. Similarly, nearly continuous exposure
to geocoronal airglow lines from the earth resulted in a large amount of
exposure at the locations a few bright emission lines, such as Lyman-β, N I,
and O I (Section 9.2 ) During detector fabrication,
measurements were made of the reported locations of an array of regularly
spaced pinholes as the voltage (and thus the detector gain and pulse height)
was varied. These tests were then considered when decisions about the final
operating voltages and electronics adjustments were made. However, no detailed
map of walk as a function of position was made before launch. After final assembly of the
detector these tests could not be repeated, but the plasma and QE grids, which
cast strong shadows on the detectors when illuminated by the stim lamps, proved
useful for measuring the effects of walk
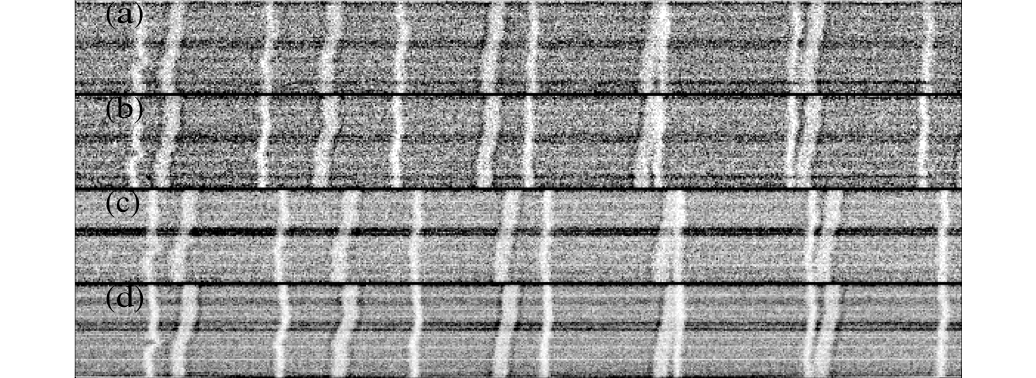
(Section 6.3.1.3). Figure 4‑18 shows a
small portion of the sum of more than 80 stim lamp exposures at several
different pulse height values. It is obvious that the shadows of the grid wires
shift in the X direction as a function of pulse height. The amount of the shift
varies with both pulse height and X position on the detector. Figure 4‑18: Multiple techniques were used to
minimize the effects of walk on the FUSE data. These included (1) adding an
occultation manager which lowered the high voltage to SAA level whenever it
wasnt needed (section 6.3.2.2); (2) regularly raising the high voltage, when
possible, to increase the overall gain of each segment
(section 4.4.2.2 The result of applying the
CalFUSE walk correction to a spectrum is shown in
Figure 4‑19, where the
same data is plotted with and without the walk correction. It is clear from the
figure that the wavelength scale differs between the two. In addition, it can
be seen that the walk-corrected spectrum has a higher resolving power. For TTAG
data, the position of each photon can be adjusted based on its pulse height.
For HIST data, however, where the pulse height data is not available, shifts
are made based on the average pulse height found at each location on the
detector based on TTAG exposures taken at nearby times. Thus the HIST
correction was only an average correction and although it helped correct the
wavelength scale, it did not do a good job of improving the resolving power.
Localized regions of gain-sag caused by airglow emission also resulted in spurious spectral features in HIST data, particularly at the wavelengths of the NI and OI airglow lines falling on LiF2a; see Figure 7.7 in Section 7.3.4 of The FUSE Data Handbook for an example, and Section 9 of this document for a listing of airglow lines.`
The FUSE design did not permit
the spectra from a particular aperture to be moved to different locations on
the detector, so the same spectral features always fell on the same part of the
detector. However, the astigmatic height of the images did spread the damage
out in the cross-dispersion direction. In addition, the grating motion (section
4.3.5), moved the spectra in both directions, which lessened the effect.
Despite this, however, significant gain variations were seen due to variations
in exposure as a function of position on the detector. Figure 4‑20 shows an example
of the effect on segment 1A. The mean pulse height is shown as a function of X
pixel at two Y locations on the detector (where the LiF LWRS spectrum falls and
in a background region) near the beginning of the mission (exposure M9980101001)
and near the end (M9986701001). The gain of the background region increased
substantially during the mission due to the increases in high voltage. The LiF1
LWRS region shows significant gain sag near the end despite the increased
voltage. The gain sag at Lyman-β (× 7000) is especially obvious, and the gain
varies significantly depending on the amount of exposure seen during the
mission. Figure 4‑19: In addition to monitoring of the
gain and walk effects using the stim lamp exposures, gain sag as a function of
time was tracked by constructing a cumulative exposure map for each detector
segment. The number of events at each pulse height value incident on each pixel
location was monitored so that trends could be identified early (Sahnow, 2004).
These total count map and total gain map files were originally constructed as
part of the pipeline flow, but they were later separated to allow more
flexibility for reprocessing.
Figure 4‑20:4.2
Telescope Alignment Performance
4.2.1 Initial
Alignment
4.2.2 Target
Peakups
4.2.3 Mirror
Motion Anomaly
4.2.3.1 On-orbit
Mirror Motion Mitigation Strategy
4.3
Spectrograph Performance
4.3.1 Spectrograph
Resolving Power
4.3.2 Scattered Light
4.3.3 Effective Area
4.3.4 The
Worms
Spectrum
LWRS
MDRS
HIRS
LiF1A
> 1050 Å- horizontal
< 1000 Å - horizontal (weak)
< 1000 Å, >1050 Å - horizontal (weak)
SiC1A
1050 - 1080 Å - horizontal
~1080 Å - horizontal (moderate)
<1065 Å - horizontal
LiF1B
~1155 Å - diagonal
Full - horizontal (2 weak stripes)
>1165 Å - diagonal (plus 2 weak horizontal worms)
SiC1B
>975 Å - diagonal (moderate)
> 960 Å diagonal (moderate)
> 970 Å - diagonal
LiF2A
<1115 Å - diagonal
1100-1130 Å Diagonal (moderate)
1100-1130 Å - diagonal (moderate)
SiC2A
-
-
-
LiF2B
-
< 990 Å - horizontal (weak)
< 1010 Å, > 1050 Å - horizontal (weak)
SiC2B
-
-
< 1035 Å - horizontal (weak)
4.3.5 Spectral
Motion
4.4
Detector On-orbit Performance
4.4.1 High Voltage
Operations
4.4.2 Gain
Sag and HV Adjustments
4.4.2.1 Gain Sag and Detector Walk
Effects
The high voltage was adjusted several times during the mission in order to increase the gain of the MCPs and decrease the effects of detector . The times of these adjustments are listed in Table 4.4‑1. Adjustments were required less frequently after the implementation of the occultation manager (Section 6.3.2.2), since the amount of exposure due to airglow lines decreased significantly at that time.
Before each permanent change in voltage, TTAG stim lamp exposures (M998 exposures) were taken at increased voltage levels. The pulse height from those datasets was used to measure the gain as a function of voltage for each aperture on each segment, and thus determine the new voltage levels. The goal with each adjustment was to keep the gain of the detector for the LiF LWRS channels high enough to avoid serious walk effects to a pulse height value of 10 or higher. Because of the very high exposure at certain locations (primarily the Lyman-β airglow line), it was not possible to return the entire detector to the desired gain level, however. In addition, raising the voltage to too high a level also had disadvantages. Segment 2A was not able to operate reliably above a value of 149 because the incidence of crackles would increase dramatically when the voltage reached that range. As a result the voltage was below its ideal value for most of the mission, and it suffered from significant walk problems.These problems were most severe at locations illuminated by strong airglow lines present when looking down at the bright Earth; see Figure 7.7 in Section 7.3.4 of The FUSE Data Handbook for an example, and Section 9 of this document for a listing of airglow lines.
Date and Time | Date | FULL Segment Voltage [1] | Reason for change | |||
---|---|---|---|---|---|---|
1A | 1B | 2A | 2B | |||
1999:181 | 6/30/1999 | 0 | 0 | 0 | 0 | Detectors turned on |
1999:225:20:23 | 8/13/1999 | 129 | 129 | 0 | 0 | Detector 1 HV ramp up |
1999:238:16:30 | 8/26/1999 | 129 | 129 | 129 | 102 | Detector 2 HV ramp up |
2001:024:23:12 | 1/24/2001 | 141 | 137 | 137 | 108 | Compensate for gain sag |
2001:212:09:41 | 7/31/2001 | 147 | 143 | 149 | 113 | Compensate for gain sag |
2002:050:08:23 | 2/19/2002 | 155 | 151 | 161 | 119 | Compensate for gain sag |
2002:088:01:06 | 3/29/2002 | 155 | 151 | 134 - 156 |
119 | 2A lowered to minimize crackles |
2002:104:17:22 | 4/14/2002 | 155 | 151 | 149 | 119 | Returned 2A to a lower level |
2002:342:21:12 | 12/8/2002 | 161 | 157 | 161 | 124 | Compensate for gain sag |
2002:350:12:00 | 12/16/2002 | 161 | 157 | 134 | 124 | 2A lowered to minimize crackles |
2003:034:13:00 | 2/3/2003 | 161 | 157 | 149 | 124 | Returned 2A to a higher value |
2003:228:16:35 | 8/16/2003 | 164 | 160 | 149 | 126 | Compensate for gain sag |
2004:202:17:55 | 7/20/2004 | 165 | 162 | 149 | 127 | Compensate for gain sag |
2007:290:20:56 | 10/17/2007 | 0 | 0 | 0 | 0 | Turned off HV |
Table 4.4‑1:
[1] Units for voltage are digital values. The value in volts is approximately 2500 + 16.7 × (digital value).
The intrinsic background rate of each detector segment was measured on the ground before launch. This background, due mainly to the beta decay of 40K in the MCP glass, was below the prelaunch specification of 0.5 counts cm-2 sec-1. After launch, an on-orbit background due to cosmic rays and other high-energy particles added to this rate to give a total rate of 0.5 1.0 counts cm-2 sec-1 using the default pulse height thresholds. Other sources of detector background included scattered light in the spectrograph.
The detector electronics permitted the adjustment of hardware charge thresholds in order to change the detectors sensitivity to background events. These were adjusted appropriately on the ground before launch and were not changed on orbit except during a few IOC and calibration observations.
For TTAG exposures, pulse height thresholding of the data was applied by CalFUSE. Since the large FUSE detectors had a wide variation in modal gain (which changed as a function of time due to gain sag see section 4.4.2) and there was no provision for position-dependent pulse height thresholds, default values of the upper and lower thresholds were chosen to accept nearly all photons where an adequate walk correction could be made in order to ensure maximum throughput. No CalFUSE thresholding could be applied to HIST data, so those exposures include events at all pulse heights above the hardware thresholds.
Since there was no shutter on the FUSE spectrograph, there was always light falling on the detectors. As a result, it was not possible to obtain any true dark exposures during the mission. At the end of the mission, however, after the baffle doors were closed for the last time, several weeks of almost-dark exposures were made. Since the baffle doors (by design) did not close completely, some light still entered the instrument in this configuration. In addition, since the SiC2 door could no longer be closed at that point, that channel was still open to the sky. Approximately 2.8 million seconds of data were collected; about 35% of that time was at night. The night time dark rate on Detector was ~3.2×10⁻⁷ counts/sec/pixel, or ~0.5 counts cm-2 sec-1 with variations of ~20% due to orbital position. Day time rate were less than 10% higher. Structure is visible in the summed data, but even with these long exposure times there was not enough data to create a true dark count map.
The background model used by CalFUSE consists of a spatially-uniform intrinsic dark count, along with separate, spatially-varying day and night components due to scattered light - see Dixon et al. (2007) and section 7.8 of the FUSE Data Handbook. Although different background templates were constructed for different times (and thus different gain regimes), correcting the background is still subject to error since the gain sag changes differently in the spectral and background regions of the detector.
Several other factors that affected the detector background are described in the following sections. No CalFUSE corrections were made for these effects.
One of the largest contributors to the detector background was proximity to the South Atlantic Anomaly. An SAA model was chosen before launch based on calculations done at Goddard Space Flight Center, and the detector high voltage was dropped to SAA level and exposures were stopped whenever the satellite was inside this SAA contour. Several SAA mapping tests were run in the summer of 2003 in order to more accurately determine the count rate on the FUSE detectors as a function of latitude and longitude in the region of the orbit near the SAA, and a permanent change to the model was made on 17 September 2003; the boundaries of this region were shown in Figure 6‑11. This model was still only approximate, however, since the size, shape, and position of the SAA varies with time. As a result, a uniform elevated background rate due to proximity to the SAA was a regular occurrence.
For maximum scheduling efficiency, the contour chosen allowed count rates of up to several hundred counts per second across the entire detector, since a uniform count rate at this level has a minimal effect on the data, and CalFUSE processing allowed users to exclude arbitrary time intervals in TTAG exposures where the background was most likely to have had an effect on the signal-to-noise ratio.
Almost immediately after the high voltage was turned on for Detector 1, unexplained intermittent bursts of counts were seen on the detectors. These event bursts had count rates of up to 20,000 per second, and could be as short as a few seconds or as long as many minutes. Although they initially were seen only at local noon and had a well-defined spatial distribution across the detector, they were later found to occur throughout orbital morning, and the spatial distributions on the detector were found to vary; they occurred on all four segments, and were seen throughout the entire mission.
The source of the event bursts was never identified. Attempts were made to correlate the time of bursts with satellite orientation, solar activity, pressure in the spectrograph cavity, and other parameters, but no definitive correlations were ever made as to their origin. There were obvious patterns, however:
(1) They were most likely to occur during orbital morning, and particularly when the instrument was pointed towards the bright earth.
(2) Multiple segments and detectors were often bursty at the same time.
(3) The time between successive bursts was very often about 6000 seconds, or one orbital period. A series of bursts would often continue throughout an observation, then stop suddenly when the slew to a new target occurred.
(4) There was often a high-frequency component of the count rate during a burst. In the cases where there enough counts to measure this period accurately, it was found to be about ten seconds. (Figure 4‑21).
(5) When the baffle doors were closed to take detector dark count measurements at the end of the mission (Section 4.4.3), no bursts were observed.
Figure 4‑21: An example of the count rate as a function of time during an event burst showing a high-frequency component is 10 seconds. The size, spatial distribution, and temporal profile of the bursts varied significantly during the mission.
Although the bursts were present for the entire mission, their character changed somewhat with time. Initially, they showed a scalloped pattern across the detector (Figure 4‑22), suggesting a reflection from the detector baffles or some other regular structure. Later, they were much more likely to show a distorted checkerboard pattern, apparently due to the grid wires shadowing the source of light (Figure 4‑23); the distortion near the top of this figure suggests that charged particles are involved. These patterns could only be identified on the brightest bursts; most had too few counts for a pattern to be identified, and could be identified only by the changes in the count rate.
Figure 4‑22:
Figure 4‑23: An example of a very large checkerboard burst on Segment 1A, shown in FARF coordinates. Note that the checkerboard pattern is distorted, while the spectrum remains undistorted.
Although a large burst could generate a significant number of counts which added to the apparent background, a relatively straightforward filtering module allowed CalFUSE to exclude them in most cases where the contamination was large enough to affect the data. The major impact on operations was due to the largest bursts triggering the detector SAA protection or the IDS FEC protection when the total number of counts in the SAA mask for a given segment exceeded their preset thresholds (see Section 4.4.8). This would result in an automatic reduction of the detector high voltage, and a concomitant loss of science data until the high voltage was restored.
Although the bursts are described here because of the effects they have on detector operations, analysis suggests that they were not actually caused by the detectors, but rather just detected by them.
Numerous times during the mission periods of high detector background were observed. These often began suddenly and disappeared just as quickly. Figure 4‑24 and Figure 4‑25 show an example for both segments of detector 2, The source of the counts seems to be between the two segments, and the scalloped pattern is reminiscent of a burst.
Figure 4‑24: Segment 2A with a high detector background.
The analog nature of the FUSE detectors means that geometric and thermal corrections must be applied to the raw data in order to ensure that all data taken is transformed to a common reference frame. In this section we will describe the source of some of these distortions, and how the on-orbit corrections were derived.
There are many sources of distortion, include ringing due to signal reflections at the ends of the delay lines, edge effects due to variations in the electric fields at the ends of the microchannel plates (including in the gap between two adjacent segments), and digital nonlinearity in the Analog-to-Digital Converters.
A correction for geometric distortion in the detector is made by the CalFUSE pipeline. The raw X and Y pixel locations are adjusted to the Flight Alignment Reference Frame (FARF) coordinates (Dixon et al., 2007). FARF coordinates represent the location where a photon actually hit the detector. As part of this correction, the Y pixel scale is adjusted to be the same on all segments. Despite this correction, the spectra do not line up perfectly on multiple segments in the corrected reference frame (Figure 2‑7).
During detector construction and testing before launch, detector distortions were measured by placing a grid of 10 m pinholes, spaced 1 2 μm apart on the front surface of the MCPs, and the linearity was determined. On orbit, final distortion corrections were determined by measuring the positions of the grid wires (separated by 1.0 1.2 μm) from stim lamp exposures, and by comparing the measured locations of spectral lines to the locations expected from raytrace models of the instrument.
An additional distortion effect discovered after launch was a slow change in the detector Y scale as a function of time. Although the cause of this phenomenon was not understood, it was monitored by tracking the slow change in the Y separation between the Lyman-β airglow lines while analyzing the spectral motion (Section 4.3.5). A calibration file was constructed with this information and used by CalFUSE.
As described in Section 6.3.1.2.1, two stim pulses were inserted into the data stream for each detector segment at the beginning and end of each exposure as a way to monitor changes in the pixel scale due to thermal variations. In addition, thermistors continually measured the temperature at a number of locations on the detector (although not on the anode).
Figure 4‑26: Temperatures measured by two of the detector thermistors during a two day period beginning on 29 August 2002 (MJD 52515), along with the high voltage on detector segment 1A at the same time. These data are taken from the engineering snapshots, and therefore are only collected during science exposures. The orbital variation of the ~1 C of the temperatures is seen, superimposed on longer-term variations, such as that due to the high voltage dropping to zero at ~1.2 days.
The on-orbit thermal environment of the detectors was quite stable during the mission as long as active control of the temperature of the spectrograph cavity was maintained. The temperatures of the FUSE spectrographs, in which the detector vacuum assemblies were mounted, were controlled by the instrument thermal control system to better than 0.2 degrees Celsius. The equipment panels on which the detector electronics assemblies were mounted, however, were not as well controlled: they typically experienced peak-to-peak variations of 1-2 C each day. Thirteen thermistors (Table 6.3‑2) were mounted on each detector to monitor how the detector temperatures varied. These temperatures typically varied cyclically by ~1 C during an orbit due to changes in the heating from the earth, while slews to a new target could results in changes of several degrees due to changes in solar illumination. In addition, changes to the instrument, such as changing the state of the detector high voltage, would result in changes to the detector temperatures (Figure 4‑26).
Stim pulse positions were measured and corrected for in CalFUSE in both the X and Y directions. Because of the larger pixel sizes in Y, and the fact that the two stims were at a similar Y location, no correction for Y stretch was made, but this had a negligible effect on the data quality. Also, because stim pulses were only inserted at the beginning and end of each exposure, the correction may not be ideal if the temperature is changing rapidly such as might happen when the high voltage had been recently ramped up to full. The changes in stim pulse position are on the order of five pixels across the entire detector per degree.
Changes to stim pulse positions generally followed the temperature changes as expected, but there were also long-term trends in the stim pulse positions which did not follow the temperature trends. These changes, which are not understood, may have caused shifts of up to several pixels in the data (Sahnow et al. 2000).
Figure 4‑27: The X shift (shift of the mean position of the two stims) and stretch (change in separation between the two stim pulses) on segment 1A, measured from the stim pulses for the same time period shown in Figure 4‑26. Large changes in both shift and stretch are seen when the high voltage shuts down.
The flat field of each detector segment includes a multitude of effects. Some of these are intrinsic to MCPs in general, while others are cosmetic features on these particular MCPs, and still others are due to the detector electronics. Because the FUSE employed detectors employed double delay-line anodes, the measured X and Y coordinates of a photon event did not correspond to a discrete physical pixel on the detector, but were calculated from timing and voltage measurements of the incoming charge cloud. As a result, the detector coordinate system was subject to drifts in the detector electronics caused by temperature changes and other effects. The difficulty of associating individual photon events with a precise location on the detector made the construction of a reliable flat-field image impossible.
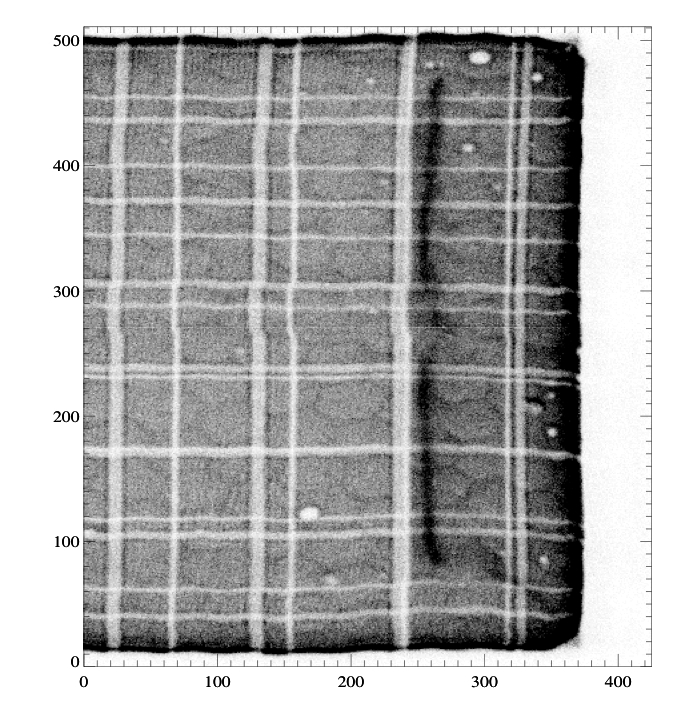
Figure 4‑28: A small section of a flat field taken before launch. This region covers 950 x 150 pixels of a single segment. The hexagonal multifiber bundles are visible, as are some brush marks and dead spots on the left side of the image. This image contains ~100 counts per pixel
Because of limitations in count rate due to the detector electronics, and concerns over the lifetime of the MCPs, it was not possible to take deep flat fields with the on-board stimulation lamp on orbit. In addition, the detector grid wires did not allow a uniform illumination.
Before launch, the fixed-pattern uniformity of the detectors was measured by placing a diffuser in front of the detectors and illuminating them with a UV lamp. Flat fields with 40 100 counts per pixel were obtained in this way. It had been hoped that the ground flats could be used, after transforming them to the flight reference frame, to flat field the on-orbit data. Due to changing thermal conditions during the ground flat exposures, however, this was not successful. The ground flats did provide a useful catalog of detector features, but they could not be satisfactorily aligned to the flight data. Figure 4‑17 shows a 950 × 150 pixel section of one of the ground flats. This area shows a range of features seen, including chicken wire, moir, brush marks, and dead spots. The following subsections describe some of these features in more detail.
A hexagonal, "chicken wire'', pattern is clearly visible in moderately deep flat fields, as shown in Figure 4‑28. These features correspond to the boundaries where individual bundles of fibers were joined in the MCP manufacturing process. Fibers near the edges of the hexagonal bundles are visibly distorted from circles to ellipses upon examination under a microscope.
This compression leads to visible variations in the flat-field characteristics due to geometrical distortion in the mapping of photocathode regions to the pixel space defined by the readout on the anode. Brighter regions in the image are not inherently more sensitive, but rather have more area on the photocathode producing events in those pixels. The measured amplitude variation was as large as ~20%.
High-frequency ripples such as those shown in Figure 4‑28and Figure 4‑29 dominate the appearance of the flat field on segment 2B, and they are also visible on segments 1A and 1B. These ripples are a Moir pattern due to beating effects between the pores in the three layers of the MCP stack (Tremsin et. al, 1999). As with the chicken wire, the variations in intensity are not due to variations in local sensitivity, but due to changes in the geometrical mapping of the photocathode to the anode readout. Bright areas in the images have more photocathode area producing events in those pixels than do dark areas.
Figure 4‑29:
Figure 4‑28 also shows features due to brush marks that were introduced when contaminants on the detector MCPs, such as dust and filaments projecting from the pores, were manually cleaned with a brush in order to minimize potential hot spots before detector assembly. The brush marks visible in the flat fields originate on the back side of the plate stack. It is believed that the abrasion of the plate surface by the brush bristles causes local variations in the electric field between the back side of the plates and the anode. The result is a geometrical distortion in the mapping of photocathode regions to the electronic pixels encoded by the anode, and brighter regions are simply collecting events from a larger area of the photocathode than are dimmer regions.
Two types of dead zones are visible in the FUSE flat-field images. The first (Type I) are simply dark spots, frequently black at the center. An example is shown in Figure 4‑30. These are regions on the detector where the sensitivity is truly lower, or even absent. Most likely they are due to blocked pores in the front face of the MCP stack.
Figure 4‑30:
Type II dead regions are also dark spots with low or no detector sensitivity. They have a bright rim around a central hole (see Figure 4‑30). Type II dead zones are believed to be due to contaminating particles on the back side of the MCP stack, either dust or whiskers protruding from an MCP pore, or blocked pores in the last plate. Like Type I dead zones, the interiors represent regions of truly reduced or absent sensitivity. The bright rims may arise from two mechanisms. Distortions in the local electric field caused by the contaminating particle or whisker can again lead to geometrical distortions in the mapping of the photocathode onto the anode readout. Another possibility is that a blocked pore only blocks a portion of the charge cloud reaching the back plate. Since the central part of the charge cloud doesn't get to the anode, the centroid is shifted radially outward, causing a bright rim.
Figure 4‑31: An isolated Type II dead zone on segment 1A is shown. Note the bright outer rim. The spot is located at (X, Y) = (10515, 530), and it has a diameter of 40 pixels in X and 25 in Y (~250 microns). The Y1=Y2 feature is also prominent.
Type II dead zones have been observed to vary in size and shape with high-voltage cycling. This supports the electrostatic interpretation, but it is not conclusive.
The pulse height effect known as walk is described in Section 4.4.2.1; other effects associated with the pulse heights of individual events are described in this section.
The "Y1 = Y2'' feature is a sharp, two-pixel-width line that runs horizontally across detector images. It is visible just above the dead spot in Figure 4‑31. This feature results when a detected event has equal charge collected from both sides of the anode, e.g., charge Y1 equals charge Y2. Since the Y coordinate is calculated from the ratio Y1/(Y1 + Y2), integer truncation leads to a deficit of events recorded in the row just below the halfway mark and a corresponding excess in the row just above it. This "halfway mark'' is near, but not at Y pixel 512 because of a coordinate shift added digitally in the detector electronics.
Events appear at both the left and right edges on all detector segments. On the left edge, the events fall in pixel X=0, while on the right edge they fall in the last 16 pixels. Most of these events have very low gain, with pulse heights below the lower pulse height thresholds used by CalFUSE. They are misimaged because the pulses are detected above threshold at only one end of the anode. Since these counts fall outside of the active area of the detector, they have no effect on the spectra; however, the lost counts can give inconsistent results between the FEC and DEC counters (Section 6.3.1.2.2.3).
Events with large pulse heights were systematically lost at the top and bottom of all detector segments (Figure 4‑32). This effect was segment dependent, and thus the default upper pulse height thresholds used for TTAG observations by CalFUSE vary with segment to ensure that counts are not lost.
The loss of counts was due to the method used to determine the Y coordinate of an event: Y = Y1/(Y1+Y2), where Y1 and Y2 are the measured charges on the upper and lower delay line. If either Y1 or Y2 exceed a certain threshold, the event is discarded. For a given pulse height (Y1+Y2) value, events near the top and bottom are more likely to have Y1 or Y2 exceed this threshold, and thus those counts are more likely to be discarded.
Figure 4‑32:
Near the high pixel edge of the segment 1A active area, the detector active area sometimes appears to fold over on itself and change direction. Figure 4‑32 shows an example of the fold in a stim lamp exposure. The bright region near X = 60 is populated by counts that should be lost beyond the right edge of the active area. In addition to being misimaged, the events have low pulse heights.
Figure 4‑33:
It is believed that this effect is due to the MCP output aperture cutting off part of the charge cloud exiting the rear of the MCPs, since the output aperture is smaller than the input aperture. These low-gain events are more easily distorted by the changing electric field near the edges of a segment. A similar effect is responsible for the highly nonlinear X pixel scale seen at the edges of the detectors; in that case, the centroids of the clouds move towards the center. Fold effects may change as a function of the MCP high voltage. No correction is made for this effect in CalFUSE.
Numerous count rate dependent effects were discovered in the FUSE detectors, and they are discussed in this section. Characterizing some of these effects proved difficult on orbit since TTAG data, which provided the most information, were used only for the lower count rate observations. In addition, stim lamp observations, which were the only ones able to sample the entire detector uniformly, could only be taken at the very highest rates since it was not possible to adjust the lamp flux.
The Y scale of the detectors was found to be a function of count rate; as the count rate increased, the number of Y pixels between two features on the detector increased. CalFUSE applies a correction factor to the raw pixel values so that all data is adjusted to the reference frame where the count rate is zero; these shifts are as much as 20 pixels at the highest count rates. The cause of this effect is not understood.
At very high count rates, the detector electronics was sometimes not fast enough to separate individual photon events. The consequence was that two photons reaching the detector at nearly the same time could be reported as a single photon. The resultant event would have the X coordinate of the first photon, along with a combined pulse height and an average Y location. In these cases a faint spectrum appears on the detector between the SiC and LiF spectra. This spectrum may appear to be from a target in the non-prime aperture, but it can be identified as a phantom by the large pulse heights. The total number of counts in the ghost spectrum is usually very low (< 1% of the true spectrum).
Ground tests on the spare detector showed that the shape of the point spread function varied with count rate, so that the detector resolution degraded as the count rate increased. This effect only became important at count rates above 5,000 total counts per second, so only HIST observations were affected. Since HIST observations were binned by 8 in the cross dispersion (and they were also often affected by detector walk effects), they typically had a slightly lower resolution to begin with, so the effect on the data was minimal.
Using on-orbit data, the width of the stim pulses as a function of total count rate was plotted for each segment. The FWHM of all stims showed a strong correlation with the count rate, although the slope of the correlation varied with both segment and stim pulse. For segment 1A, the FWHM of the right stim increased from ~2.5 to ~4.0 pixels as the count rate increased from 0 to 14,000 counts per second. As the count rate increased, the shape of the stims changed; at low rates, they are approximately Gaussian, while at higher rates a second peak which is offset in both x and y has an increasing fraction of the energy.
There were multiple effects which caused photons that were incident upon the front surface of one of the detector MCPs to be lost before they could be properly recorded. We refer to these collectively as dead time. Corrections for these effects, which are a function of count rate, are made in the CalFUSE pipeline. Details on dead time effects are given in section 6.9.
If the count rate in the ASC counter exceeded a particular threshold rate averaged over its defined integration time, the high voltage on that detector segment would drop to SAA level (section 6.3.1.2.2.3). This protection was included in the design primarily to ensure that the voltage would not remain at its full level while passing through the SAA, thus the ASC counter was often called the SAA counter. However, on orbit most shutdowns triggered this way were caused by bursts, which had not been expected before launch. Other causes of SAA shutdowns during the mission included errors in the placement or set up of the masks.
As more was learned about the properties of the bursts during the first few years, the thresholds were adjusted in an attempt to minimize shutdowns due to bursts while still providing the desired protection during the deepest SAA passages. Table 4.4‑2 shows the thresholds and integration times used during the mission for normal observations. These limits were set differently for stim lamp observations.
After an SAA shutdown, an onboard script prevented the other segment of the triggered detector from returning to full voltage once it was commanded to SAA level; executing a simple onboard script was required to return the voltage to full. Initially, this command was sent from the ground, but the recovery process was later automated so that onboard rules and scripts identified the shutdown, waited a preset time - initially 20 (starting on 5 September 2003), but later 5 minutes (beginning on 27 February 2004), and then returned the segment(s) to full voltage.
A similar voltage shutdown occurred when the FEC threshold was triggered (Section 6.3.1.2.2.3). A similar recovery procedure was used from the ground to recover from these events, which were also normally caused by bursts. These were not automated, however, because no detector diagnostic was issued in that case.
SAA shutdowns were relatively common occurrences. During the mission, 197 occurred, along with 8 FEC shutdowns.
The previous section noted that most SAA shutdowns were really due to bursts. However, there were times when the detectors did pass through the SAA with the high voltage at FULL voltage. Since the thresholds had been set relatively high to avoid tripping on bursts, these shutdowns typically did not occur until FUSE passed through the center of the SAA, where the particle flux (and consequently the count rate on the detectors) is the highest. Passing through the SAA at full voltage can cause scrubbing of the detectors; since the scrubbing is uniform, it does not result in differential gain sag, however. The small number of these SAA passages at full voltage during the mission had a negligible effect on the detector lifetime. Most of these incursions were caused for one of two reasons: either the SAA manager rules in the IDS were not running, or an attempt was made to ramp up the high voltage while passing through the SAA.
Following in-orbit checkout, FES A was used almost exclusively for target acquisition and guiding until mid-2005. During this time, FES B was used only during periods when the FES A CCD was being annealed.
Scattering by micro-roughness of the LiF primary mirrors or the internal FES optics was quite low, which enabled tracking of guide stars even when very bright objects such as planets were in the field of view. As a result, there was no operational necessity for use of the filter wheel, and the filter wheels were left in the clear position throughout the mission.
Radiation damage from cosmic rays caused a gradual increase in dark current for a subset of FES pixels. These warm pixels are easily seen in Figure 4‑34 as small faint spots affecting single pixels. The star images are much larger, as the FES optics were designed to produce spots 2-3 pixels in diameter to ensure good sampling of the PSF for accurate centroiding. This image was obtained on 15 May 2000, after almost 11 months in orbit and one month prior to the first FES annealing cycle. The image was obtained near entry into orbital night : the level of stray light is just slightly elevated, providing just enough contrast to show the borders of the field stop. Many faint warm pixels are visible in the field stop region at the bottom of the image.
Figure 4‑34:
The photometric calibration of FES intensities measured on 2 × 2-binned acquisition images and based on HST Guide Star Catalog (GSC) star magnitudes is shown in the upper panel of Figure 4‑35. The large scatter is due to inaccuracies in the GSC ( 0.3 mag), the difference in responses of the unfiltered FES and the filters used for the GSC, stellar variability, and to some extent, the location of the stars on the subpixel scale of the FES. The FES intensities were typically larger due to its additional red response. Positional errors are independent of brightness (lower panel of Figure 4‑35) a result unexpected based on pre-launch considerations. For the FUSE quaternion estimator, variances used for weighting positional accuracies are scaled from the intensity in a simplification of the algorithm. True variances in the measured position would provide more accurate weighting of stars with poor positions. The scatter in the lower panel of Figure 4‑35 illustrates why object intensity was not an explicit criterion in the star identification method used by FUSE and why up to four guide stars were chosen for tracking, particularly if only faint guide stars were present in the field. It was not uncommon for the FES measurements to be 0.75 mag off from the GSC values, i.e., a factor of 2 in intensity.
Figure 4‑35: FES intensities (top) and positional errors (bottom) compared with HST GSC values.
The FUSE baffles on the LiF channels provided good rejection of stray light from the Sun, and from the sunlit-Earth when the angle between the telescopr boresight and the Earth limb was greater than 25 degrees. However, at lower limb angles the stray light entering the FES could be significant, especially near orbit noon.
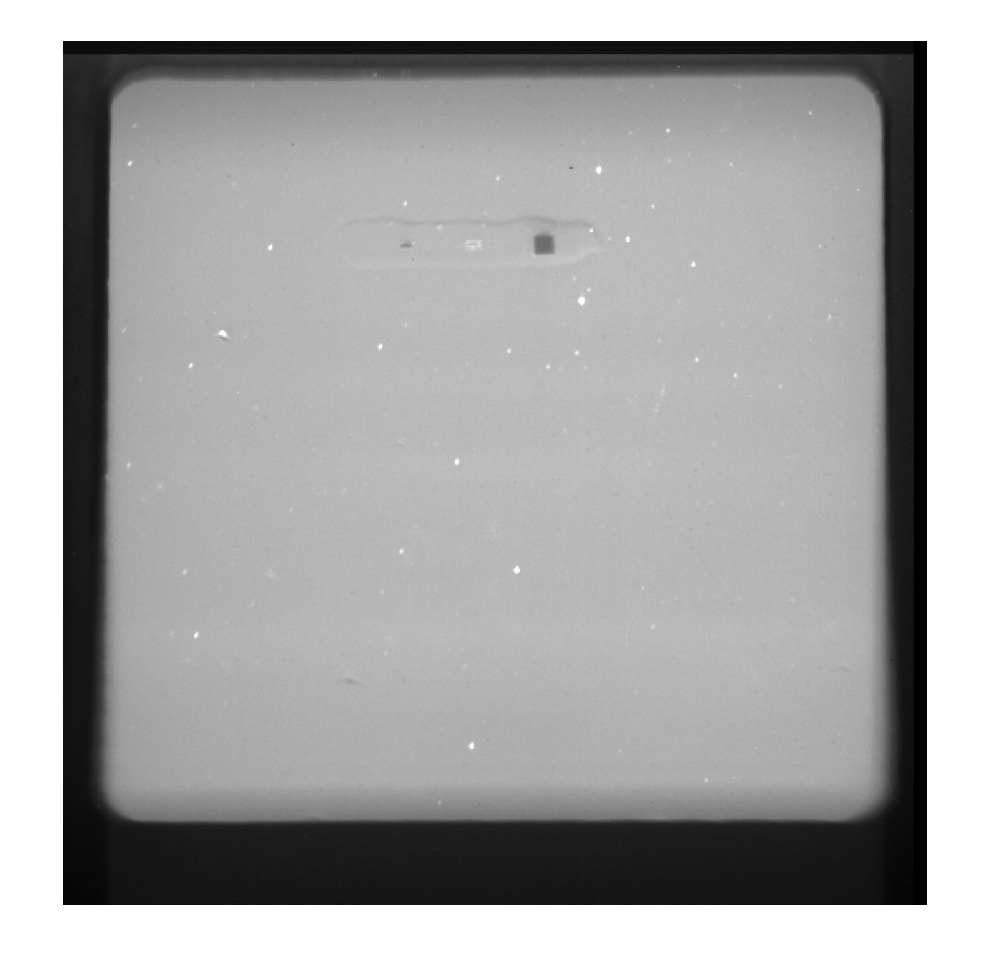
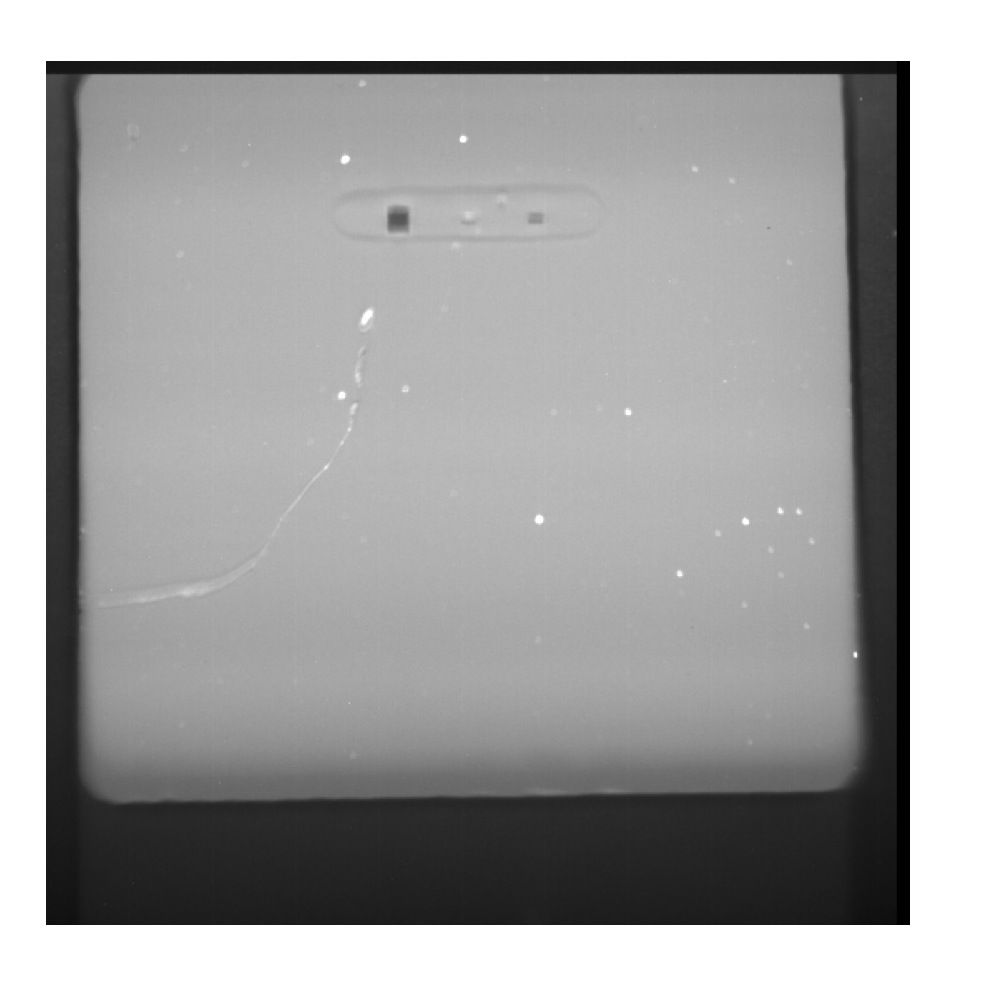
Examples of FES-A and FES-B images, taken near orbit noon where scattered light from the sun is most pronounced, are shown in Figure 4‑36. This figure illustrates the impact of scattered light on the guide star acquisition process.
Figure 4‑36:
Figure 4-37: A raw FES-B image with a high level of scattered light is shown. The dark border seen on three sides is the aperture mask. The spectrograph apertures are visible: LWRS, HIRS,MDRS in order from left to right. Light scattered by edges of HIRS make it appear bright in this image. The dimpled region surrounding the apertures is an artifact of the manufacture of the FPA mirrors. A long scratch in the FPA is visible on the left side of the image.
The first in a series of intermittent spontaneous FES-A reboots occurred on day 105 (April 15) of 2005. When the reboots occurred, FES-A was left in Boot mode, and could not be commanded to application mode without first cycling the power. We operated with this anomaly for several months, but ultimately decided to switch to FES-B on July 12, 2005. FES-A was not used for guiding during the rest of the FUSE mission. Further details and a discussion of the FES-B focus performance are presented in Section 6.4.2.
Next: Bright Target Observing Strategies & Restrictions Previous: The FUSE Spacecraft Table of Contents: Table of Contents