
Mission Overview
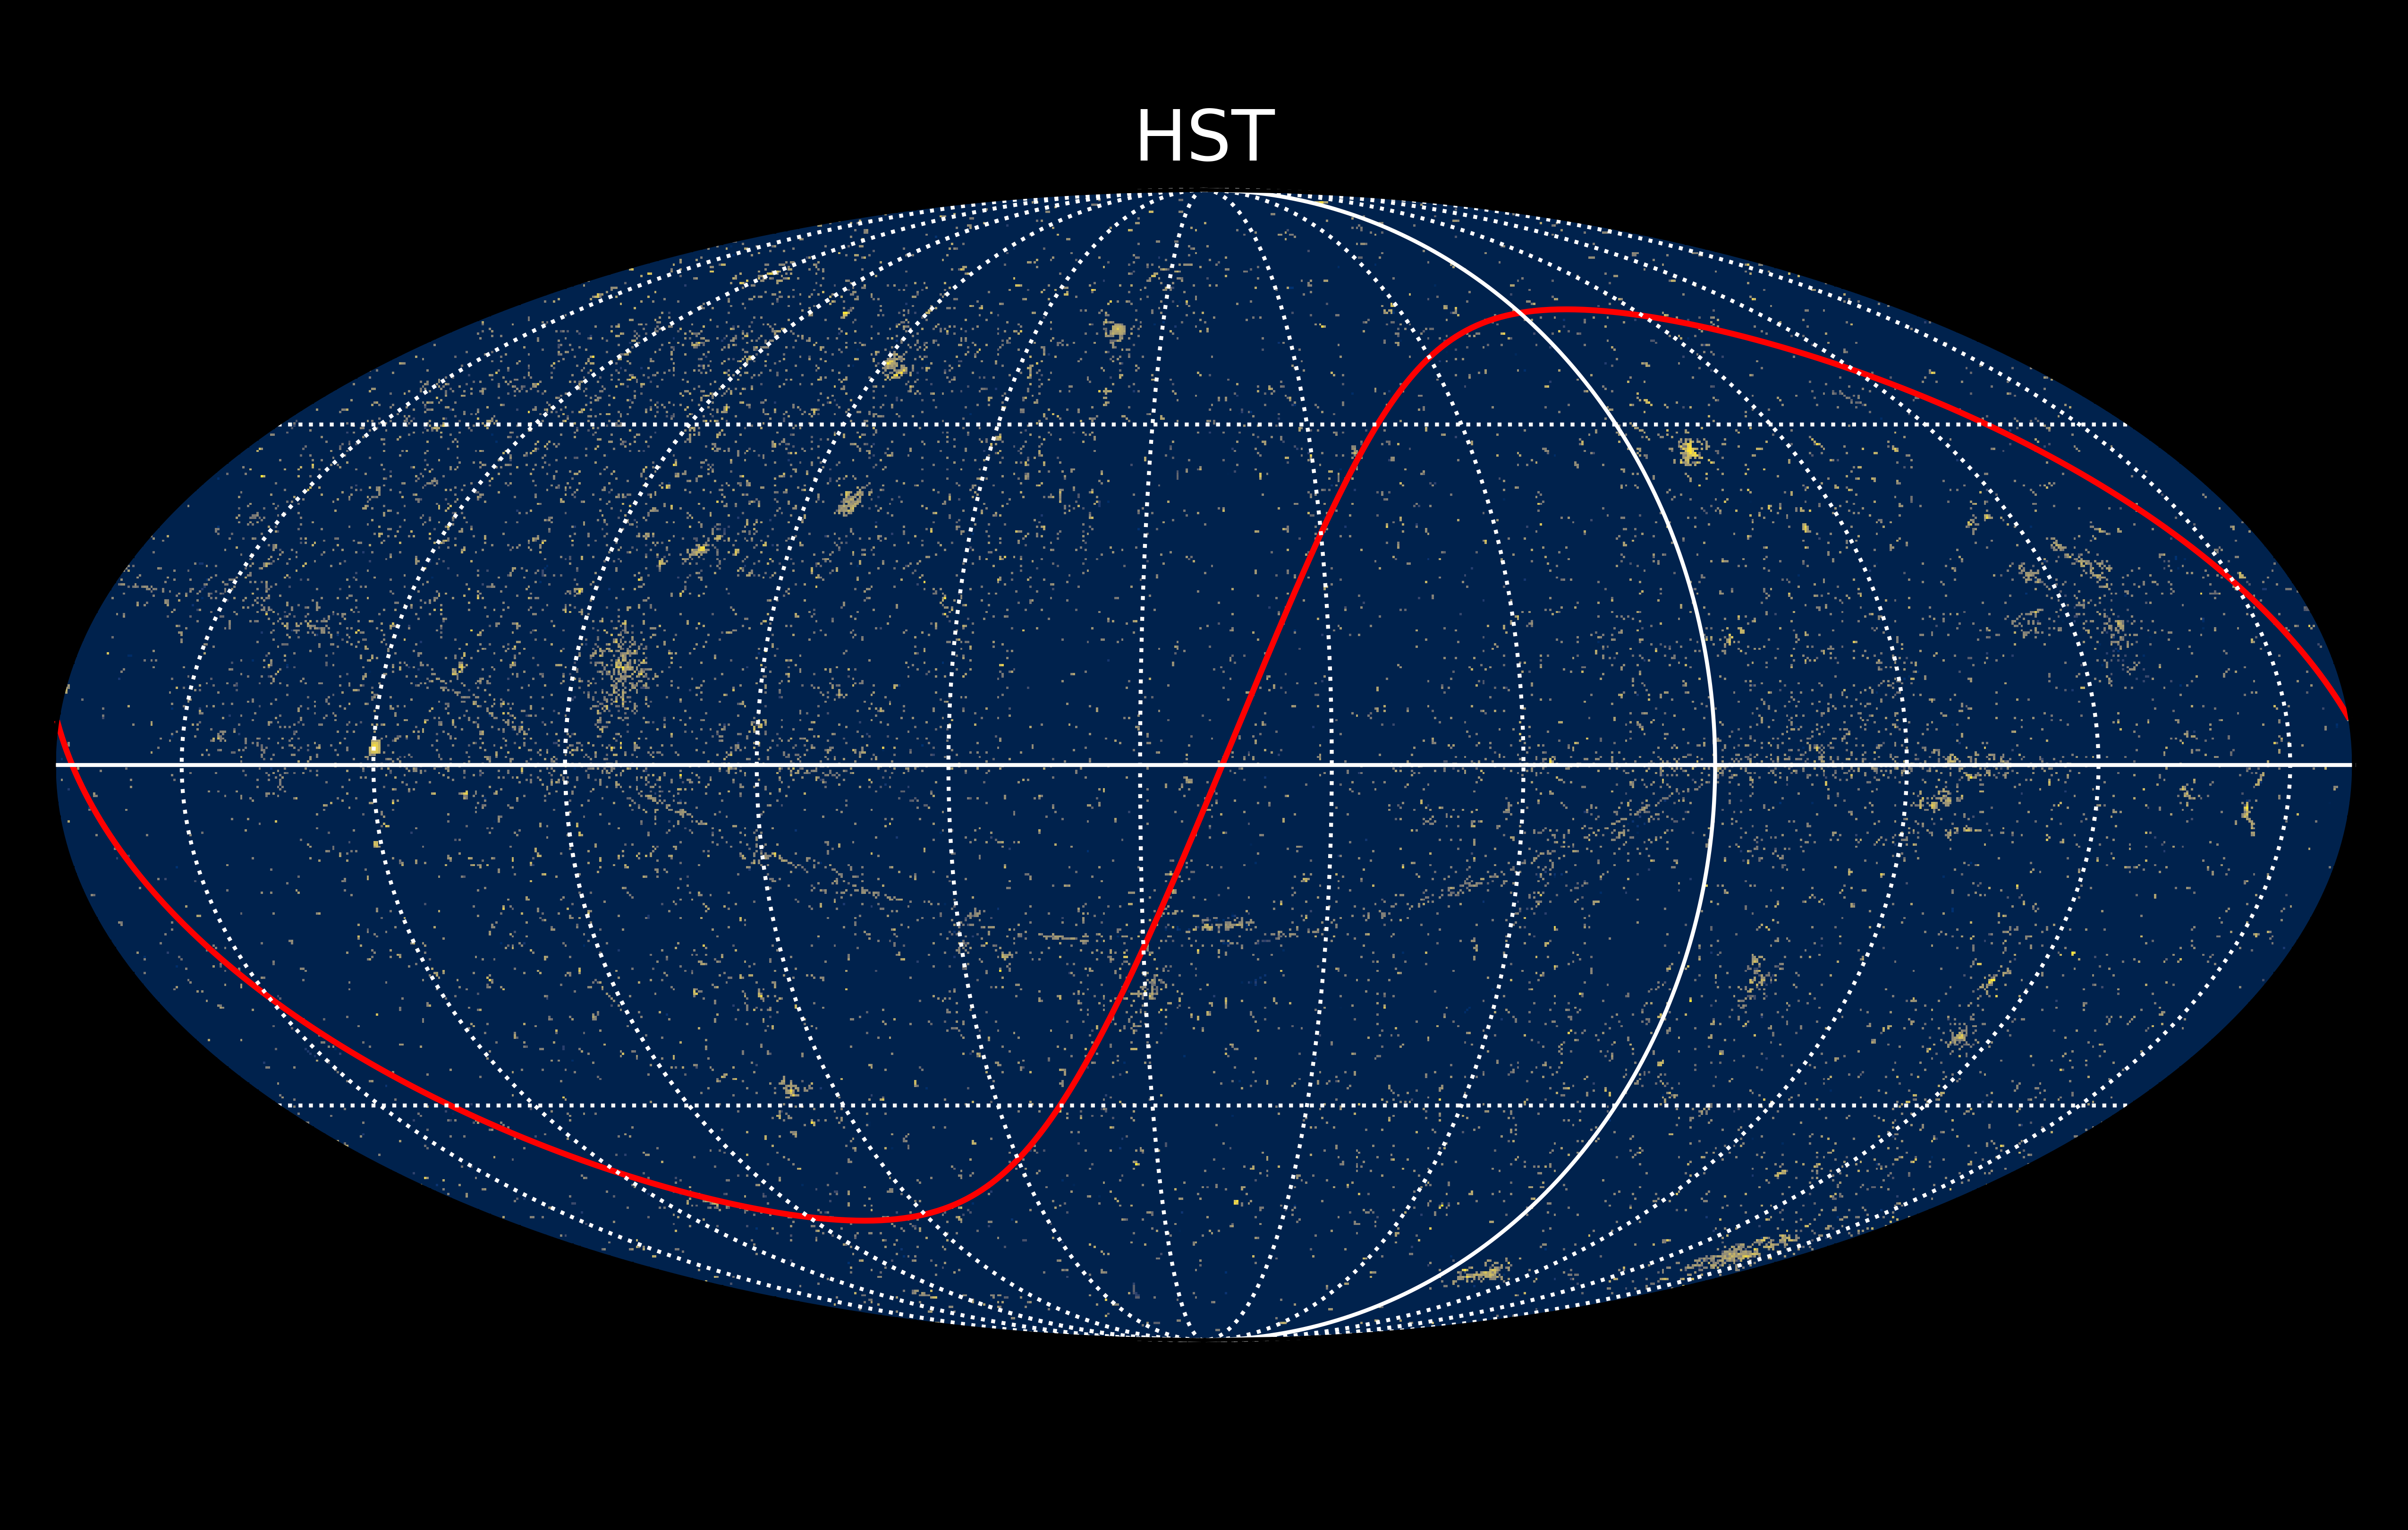
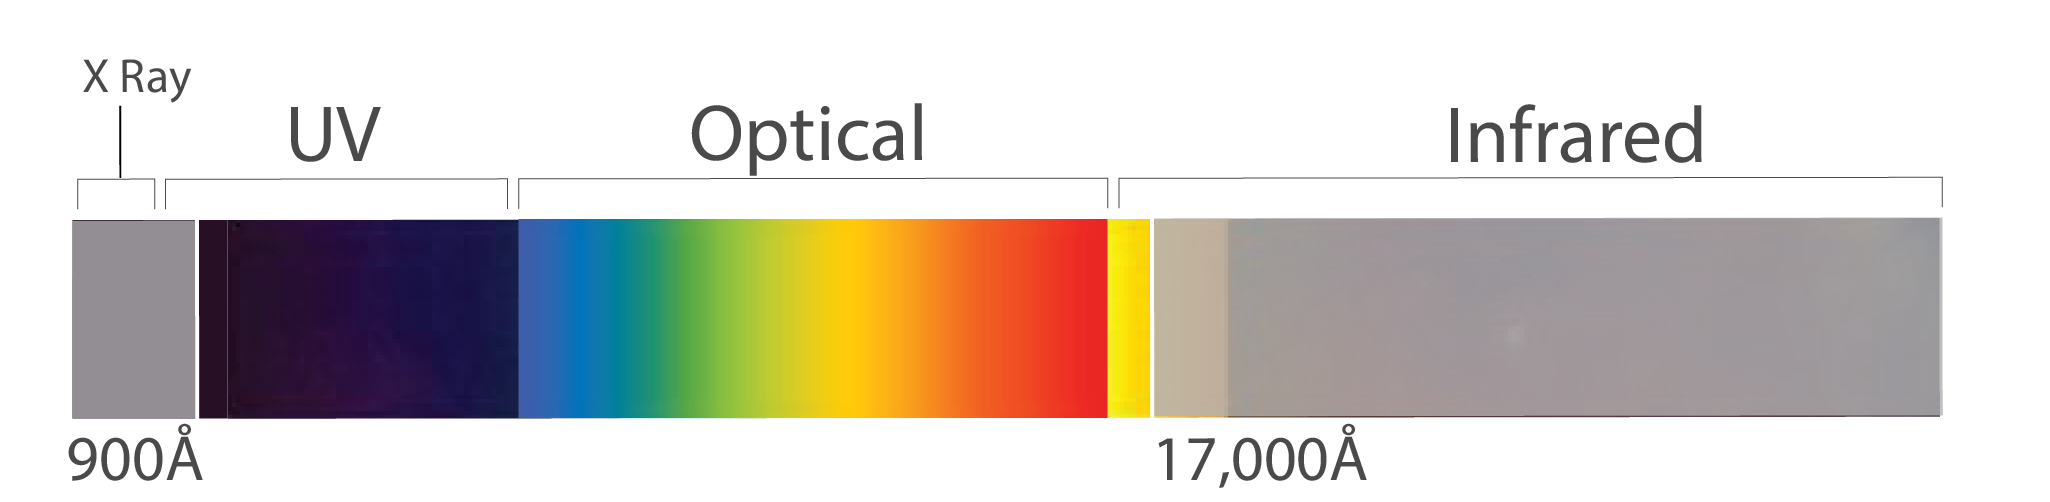
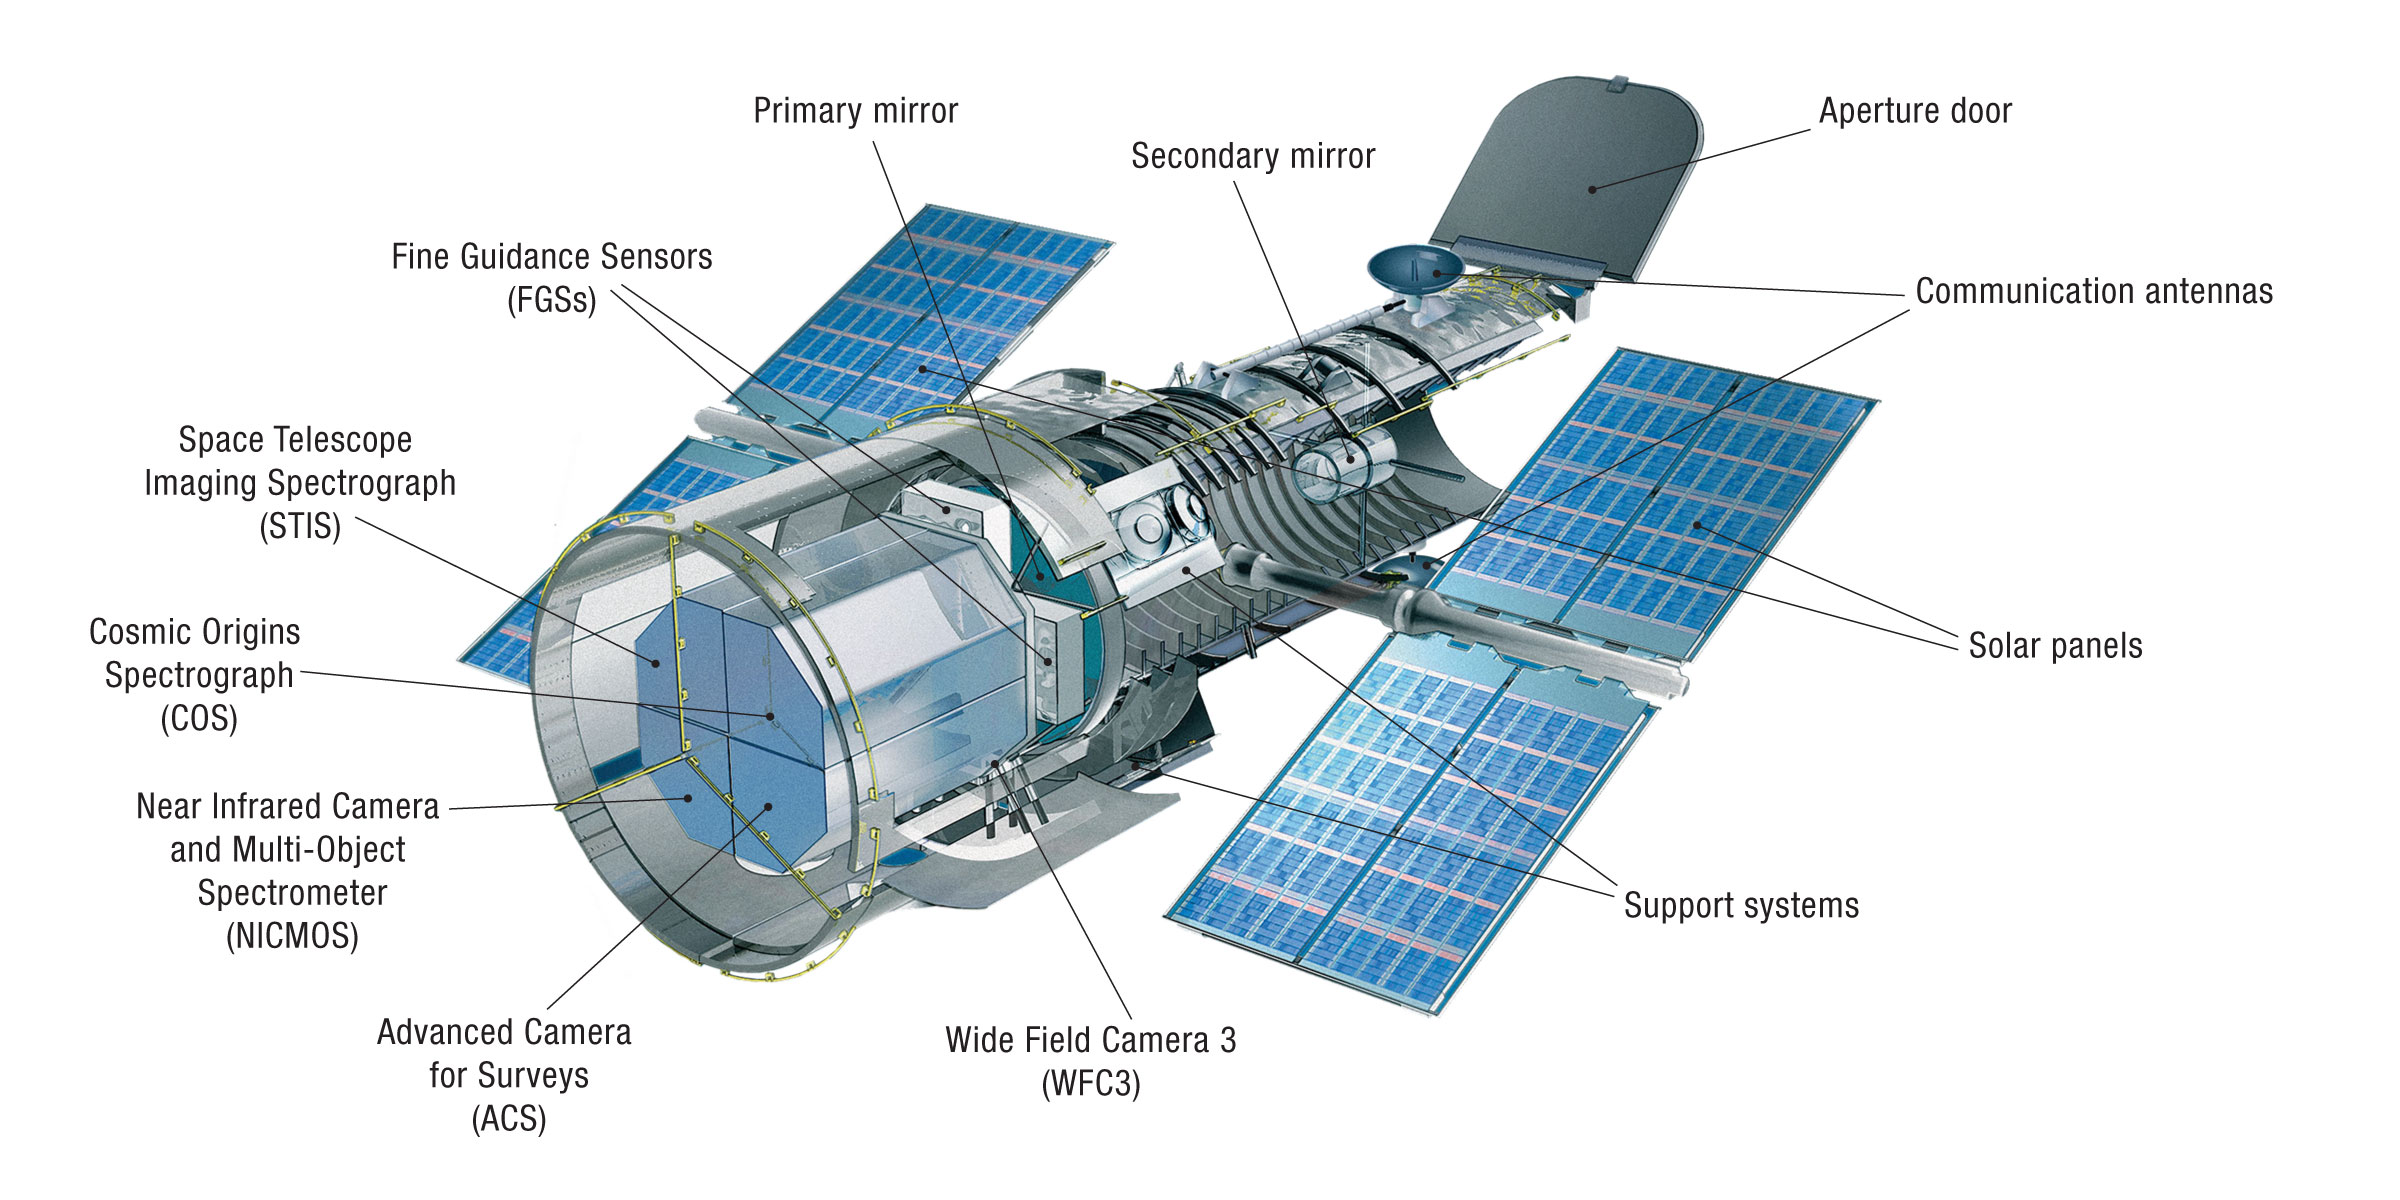
The Hubble Space Telescope (HST) is a 2.4-meter reflecting telescope, which was deployed in low-Earth orbit (600 kilometers) by the crew of the space shuttle Discovery (STS-31) on 25 April 1990. HST was designed to be a different type of mission for NASA -- a long-term, space-based observatory with regular servicing missions. HST's current complement of science instruments includes three cameras (ACS, WFC3/UVIS, and WFC3/IR), two spectrographs (COS and STIS), and fine guidance sensors (FGS). These science instruments can produce high-resolution images and spectra of astronomical objects and can also observe ultraviolet radiation, which is blocked by the atmosphere and therefore unavailable to ground-based telescopes. In the infrared portion of the spectrum, the Earth’s atmosphere adds a great deal of background, which is absent in Hubble observations.
After launch, scientists discovered spherical aberration in HST's main mirror, which resulted in fuzzy images. The STS-61 (Endeavour) mission of December 1993 corrected the effects of spherical aberration and fully restored the functionality of HST. Since then, servicing missions have regularly provided opportunities to repair aging and failed equipment as well as incorporate new technologies in the telescope, especially in the Science Instruments that are the heart of its operations. HST was on a three-year cycle of on-orbit servicing, with servicing missions in December 1993, February 1997, December 1999, March 2002 and May 2009. No future servicing missions are planned at this time.
More information and documentation on HST can be found at the HST website.
Active From
Launch: April 1990
Observation: March 18, 1991 - present
Resolution
Imaging FWHM ≈ 0.067-0.156 arcsec
Spectroscopy resolving power R (= λ/∆λ) ≈ 70-114,000
Capabilities
- UV, optical, and NIR imaging
- UV, optical, and NIR spectroscopy
- Coronagraphy
- Interferometry for precision astrometry
Documentation
Instruments
Active
HST Instrumentation-
Wide Field Camera 3
-
Cosmic Origins Spectrograph
-
Space Telescope Imaging Spectrograph
-
Advanced Camera for Surveys
-
Fine Guidance Sensors


-
High Speed Photometer
-
Faint Object Spectrograph
-
Faint Object Camera
-
Goddard High-Resolution Spectrograph
-
Near Infrared Camera and Multi-Object Spectrometer
-
Wide Field/Planetary Camera 1
-
Wide Field and Planetary Camera 2


| Instrument |
Direct Imaging |
Coronography | Polarimetry |
Time-series Observations |
Spectroscopy | Wavelength Coverage | Instrument In-Service Dates |
|---|---|---|---|---|---|---|---|
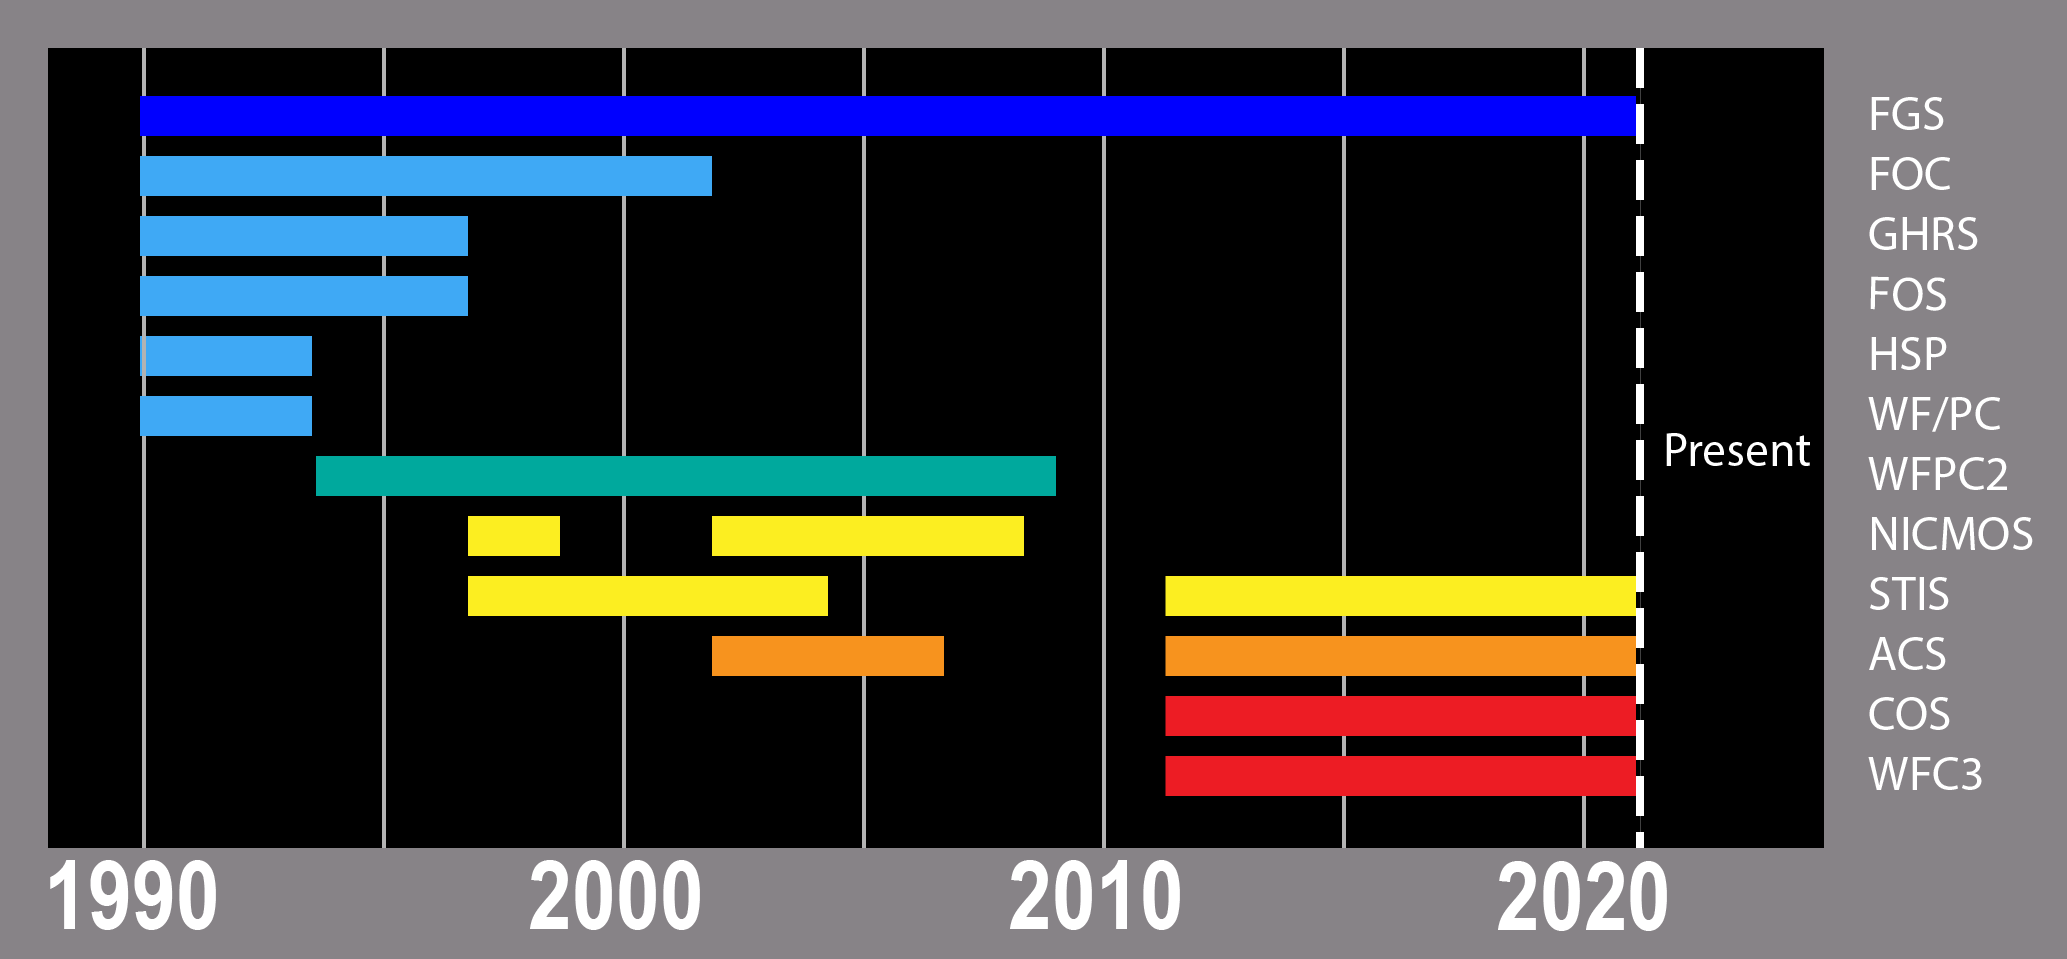
| COS | X | X | UV | May 2009 - present | |||
| WFC3 | X | X | UV, Vis, IR | May 2009 - present | |||
| ACS | X | X | X | X | X | UV, Vis | Mar 2002 -Jan 2007 & May 2009 - present |
| STIS | X | X | X | X | UV, Vis |
Feb 1997 -Aug 2004 & May 2009 - present |
|
| NICMOS | X | X | X | IR | Feb 1997 - Jan 1999 & Mar 2002 - Sep 2008 | ||
| WFPC2 | X | X | UV, Vis | Dec 1993 - May 2009 | |||
| FOC | X | X | X | UV, Vis | Apr 1990 - Mar 2002 | ||
| FOS | X | X | X | UV, Vis | Apr 1990 - Feb 1997 | ||
| GHRS | X | X | UV | Apr 1990 - Feb 1997 | |||
| HSP | X | X | UV, Vis | Apr 1990 - Nov 1993 | |||
| WF/PC | X | X | X | UV, Vis | Apr 1990 - Nov 1993 |
Search Tools
-
Hubble Source Catalog Search

The Hubble Source Catalog (HSC) is designed to optimize science from the Hubble Space Telescope by combining the tens of thousands of visit-based source lists in the Hubble Legacy Archive (HLA) into a single master catalog
-
Hubble Search

Search for Hubble data with this easy to use form. New to Hubble data? This is a great place to start.
-
MAST Portal

Search multiple collections of astronomical data-sets from one place—images, spectra, catalogs, timeseries, publication records and more
-
Astroquery

A streamlined interface for Python users to access data in MAST. Replicates most functions of the MAST Portal web interface. Access MAST queries using the same function conventions and return types available for all Astroquery services. Integrates easily with Astropy functionality and other Python analysis tools.
-
z.MAST

Search for extragalactic observations and catalog data from MAST high-level science products (HLSP). Download results for further analysis or quickly view detailed information by individual galaxy—aggregated data, image cutouts, observed SEDs, and observations
-
Amazon Web Services

This dataset contains calibrated and raw data for all of the currently active instruments on HST: ACS, COS, STIS and WFC3.
-
HST Program Information

To obtain information about a specific program, enter the Program ID or the Investigator's Name and hit one of the buttons to the right of the entry box. When entering an investigator's name, either just the LAST name or both the FIRST and LAST name may be specified.
-
HST Abstract Search

Search the HST proposal abstracts and/or proposal titles for specific strings of interest. You may also search the HST abstracts database for a specific Guest Investigator (either in combination with a string search of the abstracts or alone).
Data Products
There are three categories of data products linked below: imaging, spectroscopy, and catalogs.
1: Imaging
-
Hubble Advanced Products

These 'Hubble Advanced Products' (HAP) are referred to as 'Single Visit Mosaics' (SVMs) and 'Multi Visit Mosaics' (MVMs). SVMs are all drizzled onto the same north-up pixel grid; they may have improved relative alignment, enabling easy comparison of the images through multiple filters. MVMs combine public observations of fields observed multiple times by ACS and WFC3 into a set of products drizzled onto a common, pre-defined pixel grid.
-
Hubble Legacy Archive

The Hubble Legacy Archive (HLA) is designed to optimize science from the Hubble Space Telescope by providing online, enhanced Hubble products and advanced browsing capabilities. The HLA is a joint project of the Space Telescope Science Institute (STScI), the Space Telescope European Coordinating Facility (ST-ECF), and the Canadian Astronomy Data Centre (CADC).
-
MAST HLSPs

High Level Science Products are observations, catalogs, or models that complement, or are derived from, MAST-supported missions, including HST. HLSPs can include images, spectra, light curves, maps, source catalogs, or simulations. They can include observations from other telescopes, or data that have been processed in a way that differs from what's available in the originating archive.
2: Spectroscopy
-
Hubble Spectroscopic Legacy Archive

HSLA combines data from multiple observing programs, instruments, and gratings to create spectral products with the highest possible signal-to-noise ratio and wavelength coverage. It also performs automatic target classification, enabling searches based on object classification as well as by target name.
-
HASP

Released December 2023, HASP provides high-quality one-dimensional spectra for HST spectroscopic data. HASP offers robust coadded and combined products for nearly every COS and STIS spectrum, covering over 3200 programs and 64000 input datasets in MAST.
-
MAST HLSPs
High Level Science Products are observations, catalogs, or models that complement, or are derived from, MAST-supported missions, including HST. HLSPs can include images, spectra, light curves, maps, source catalogs, or simulations. They can include observations from other telescopes, or data that have been processed in a way that differs from what's available in the originating archive.
3: Catalogs
-
Hubble Catalog of Variables

The Hubble Catalog of Variables (HCV) is the first full, homogeneous, catalog of variable sources found in the Hubble Source Catalog (HSC), which is built out of publicly available images obtained with the WFPC2, ACS, and WFC3 instruments onboard the HST. The HCV is the deepest catalog of variables available. It includes variable stars in our Galaxy and nearby galaxies, as well as transients and variable active galactic nuclei.
-
Hubble Source Catalog (HSC) Search

The Hubble Source Catalog (HSC) is designed to optimize science from the Hubble Space Telescope by combining the tens of thousands of visit-based source lists in the Hubble Legacy Archive (HLA) into a single catalog. Version 3 was released on July 5, 2018 and includes many improvements in the photometry and astrometry along with a significant increase in the number of objects and measurements.