
Mission Overview
The TESS Stellar Variability Catalog (TESS-SVC)
Primary Investigator: Tara Fetherolf
HLSP Authors: Tara Fetherolf, Joshua Pepper, Emilie Simpson, Stephen R. Kane, Teo Mocnik, John Edward English, Victoria Antoci, Daniel Huber, Jon M. Jenkins, Keivan Stassun, Joseph D. Twicken, Roland Vanderspek, Joshua N. Winn
Released: 2023-08-15
Updated: 2023-08-15
Primary Reference(s): Fetherolf et al. 2023
DOI: 10.17909/f8pz-vj63
Citations: See ADS statistics
Slideshow
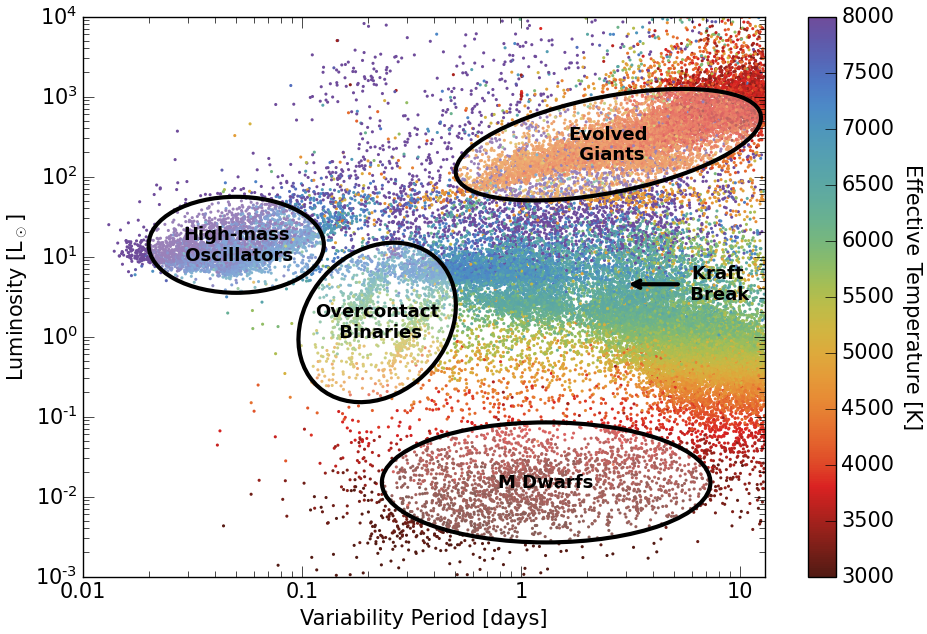
Calculated stellar luminosities versus the measured variability periods of stars that are identified as significantly variable, and thus are included in TESS-SVC. The points are colored by the effective temperatures reported by the TESS Input Catalog (TIC; Stassun et al. 2018; Stassun et al. 2019), and luminosities are calculated from the effective temperatures and stellar radii available in the TIC (Stassun et al. 2018; Stassun et al. 2019). Several known astrophysical relationships are highlighted and labeled with faded ellipses.
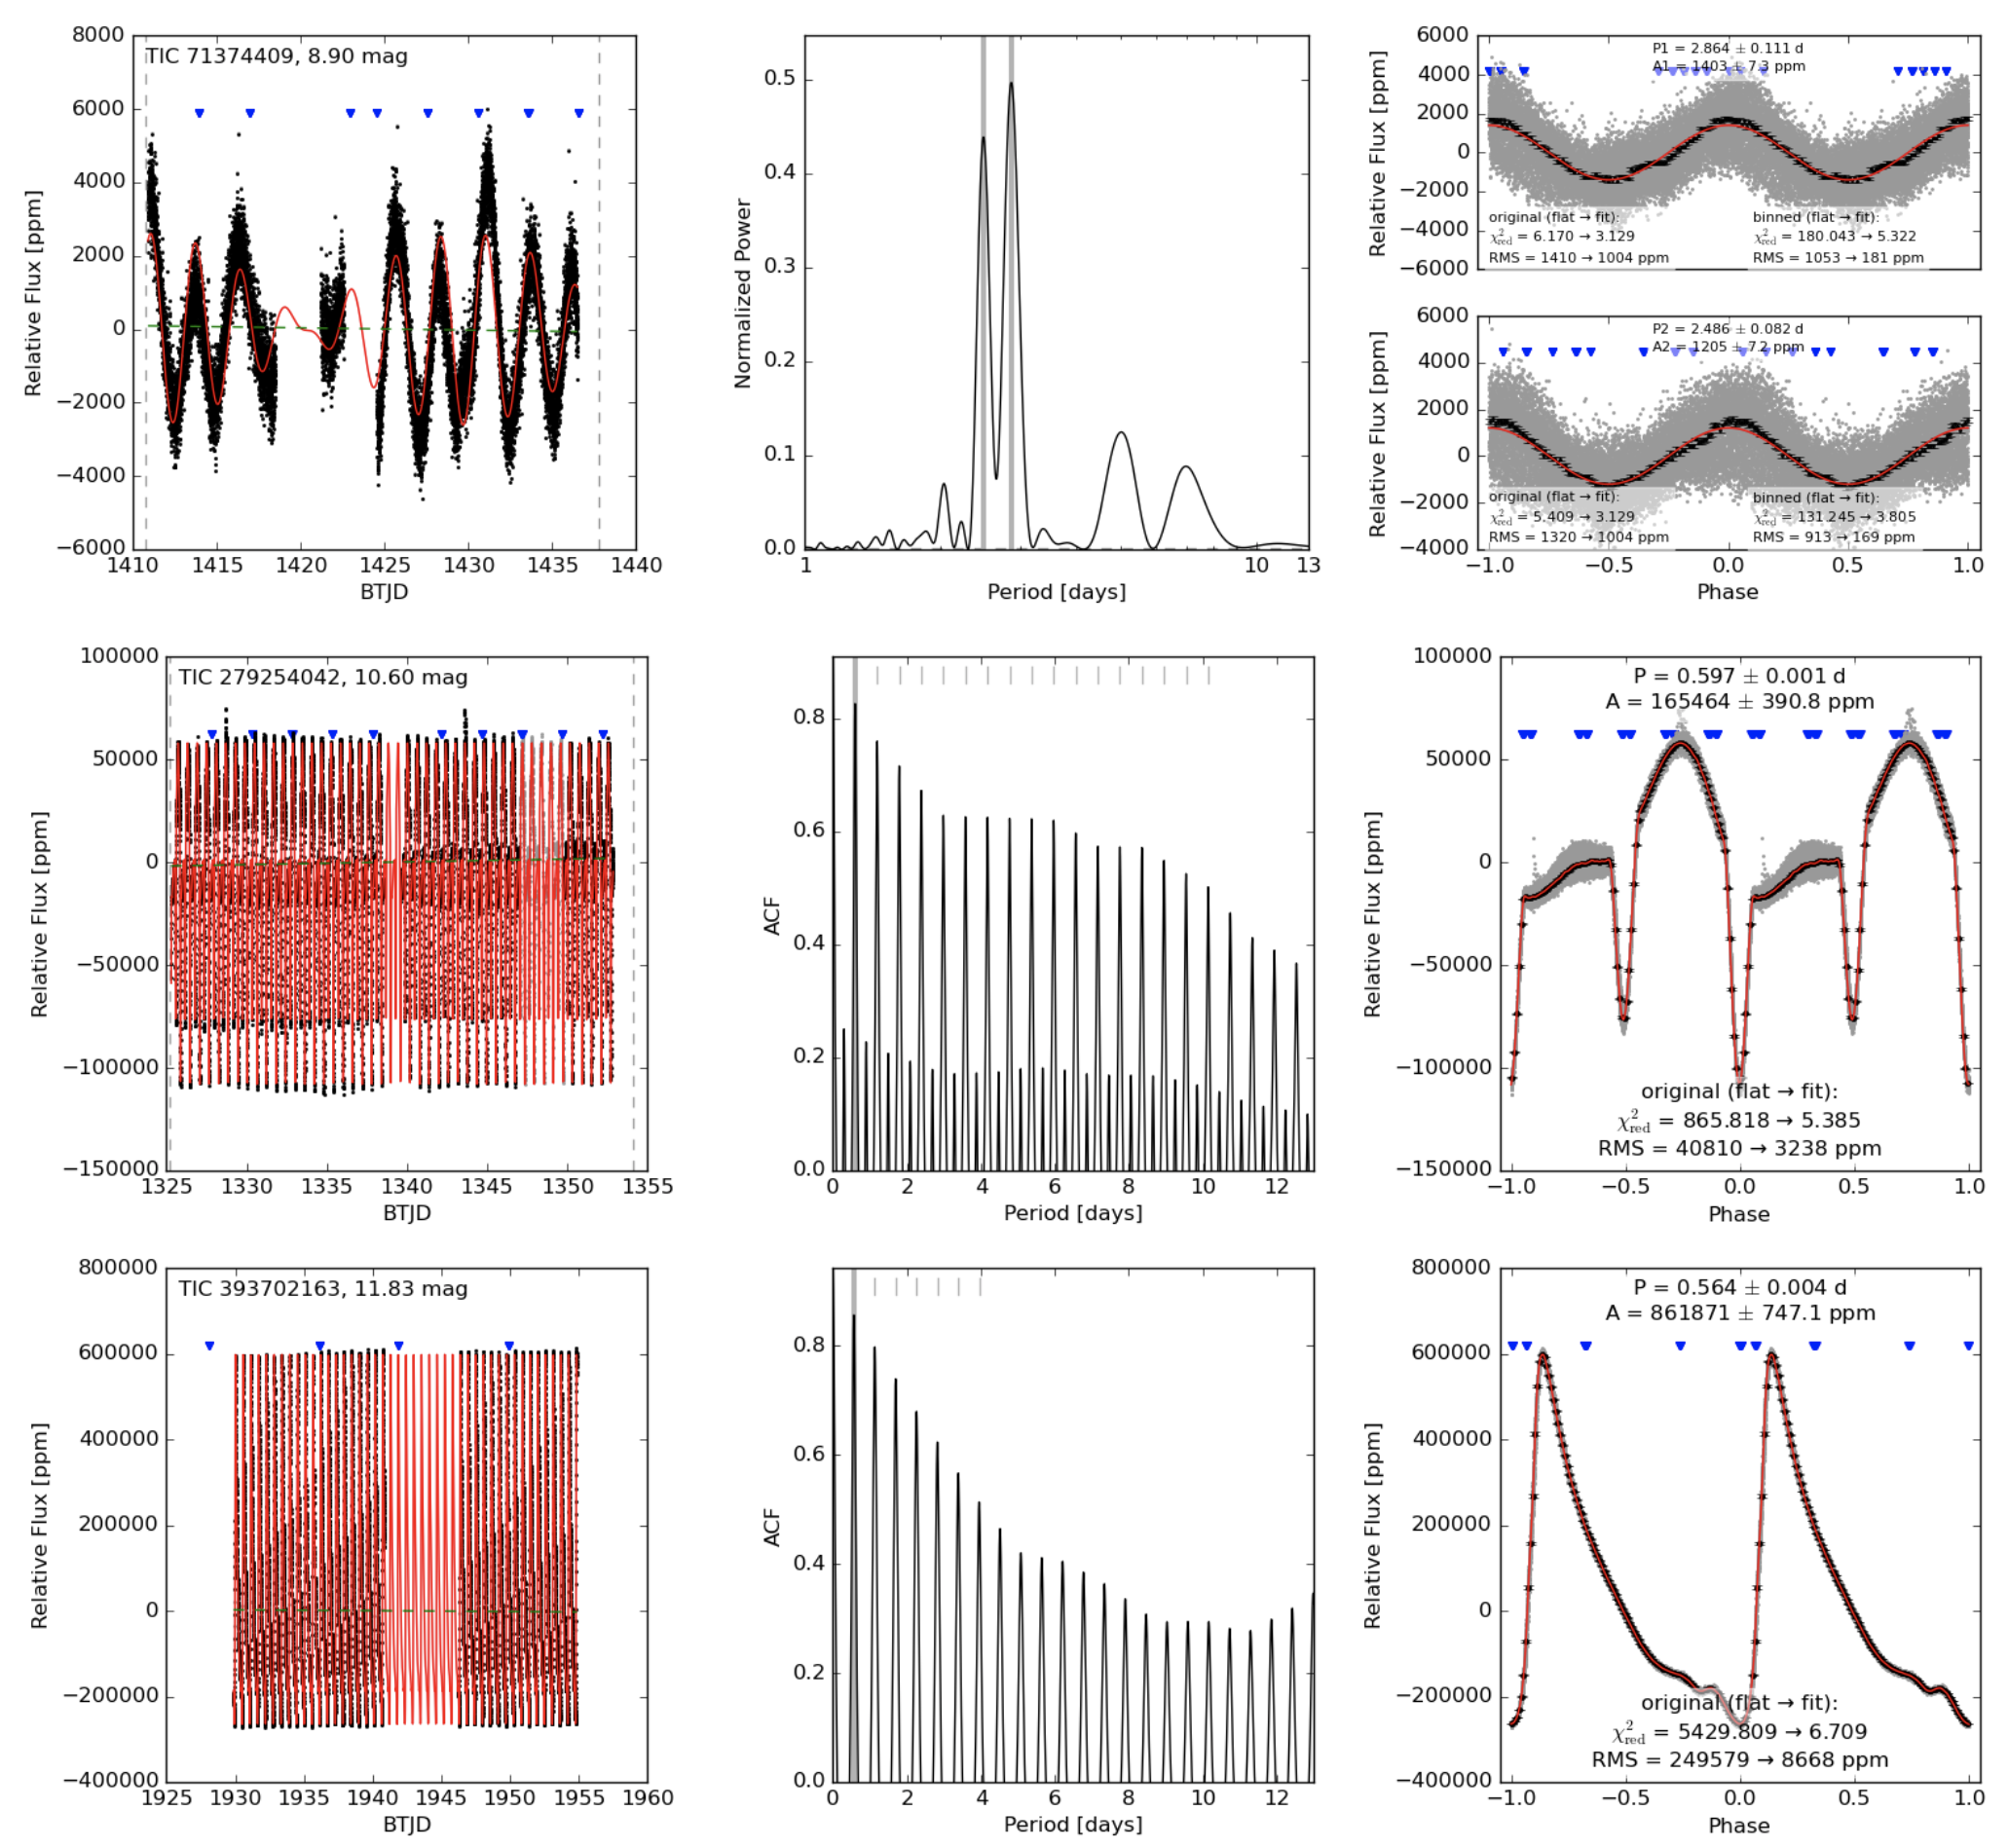
Three examples of the figures that are available for each star that is considered as significantly variable and included in TESS-SVC. The panels in each of the three stacked figures show the single sector light curve (left), periodogram or auto-correlation function (center), and phase-folded light curve (right) that are output from the variability analysis described in Fetherolf et al. (2023). The red curve represents the best-fit sinusoidal function, double-sinusoidal function, or auto-correlation function. The blue triangles denote spacecraft momentum dump timings. The black points in the right panels show the medians of 100 bins for the phase curve.
Overview
The TESS Stellar Variability Catalog (TESS-SVC) describes which stars, among those observed at 2-min cadence in the TESS light curve photometry, show periodic variability over the timescales of 0.01 to 13 days. The TESS-SVC includes a broad range of periodic variable stars (rotation, pulsation, eclipsing binaries, etc.) that were selected based on the photometric periodogram analysis described in Fetherolf et al. 2023. Each star in the TESS-SVC includes the measured period of photometric variability, time and amplitude of the maximum flux, significance of the detected variability signal, properties extracted from the TESS Input Catalog, and a summary figure. Each summary figure shows the full TESS light curve (left panels), Lomb-Scargle periodogram or auto-correlation function (center panels), and the light curve phase-folded on the measured photometric variability period (right panels). The periodogram results provided are extracted from a single sector of TESS PDCSAP photometry, and the method for selecting the specific sector for stars observed in multiple TESS sectors is described in Fetherolf et al. 2023. You can also use an online visualization tool to interact directly with this dataset.
Data Products
The current version of the TESS-SVC (v1.0) includes 84,046 stars that are considered significantly variable on timescales of 0.01-13 days; these stars were observed at a 2-min cadence during the TESS Prime Mission (Sectors 1-26). There are 68,497 stars with photometric variability that is best described by a single-sinusoidal function (1sin), 10,887 stars with photometric variability that is best described by a double-sinusoidal function (2sin), and 4662 stars with photometric variability that is best described by an auto-correlation function (acf). The catalog will continue to be updated as new sectors become available, and will later include stars that exhibit photometric variability on timescales longer than 13 days.
The catalog file names will change in future data releases following this pattern:
hlsp_tess-svc_tess_lcf_<solution>-<sectors>_tess_<ver>_cat.csv
where:
- <solution> = a designation of the method that best described the photometric variability, which can be a single-sinusoidal function (1sin), double-sinusoidal function (2sin), or auto-correlation function (acf). The combined variability catalog is represented by "all" and contains an additional "Solution" column.
- <sectors> = the dash-separated range of sectors covered by the catalog. In v1.0, this field is s0001-s0026, meaning TESS Sectors 1 through 26.
- <ver> = MAST version number of the catalog, e.g. "v1.0".
The summary figures show the results from the variability analysis and their naming follows this pattern:
hlsp_tess-svc_tess_lcf_tic<tess_id>_tess_<ver>_img.png
where:
- <tess_id> = TESS Input Catalog object identifier
- <ver> = MAST version number of the catalog, e.g. "v1.0".
Data file types:
| <solution>...cat.csv | Catalog files containing the photometric variability solutions detailed by <solution> (all, 1sin, 2sin, or acf), as detailed above. |
| img.zip | Zip file containing all 84,046 summary figures in the form of hlsp_tess-svc_tess_lcf_tic<tess_id>_tess_<ver>_img.png |
Data Access
| Catalog Files | Size |
|---|---|
| 93 MB | |
| 75 MB | |
| 14 MB | |
| 5 MB |
| Figure Files Bulk Download | Compressed Size |
|---|---|
| 15 GB |