a) Available Short-Wavelength Atlases
Since the completion of the processing of IUE data with NEWSIPS
in 1997, new spectral atlases have been constructed using
the GHRS wavelength calibration. Both the IUE/NEWSIPS and
GHRS wavelength calibrations are derived from
a recent homogeneous study of ultraviolet platinum lines
(Reader et al. 1990). The most important atlas for purposes of comparison
to IUE/SWP data is the Brandt et al. (1998) atlas of 10 Lacertae.
This work covers the region
![]()
![]() 1181-1777, which is most of
the wavelength range covered by the SWP camera (
1181-1777, which is most of
the wavelength range covered by the SWP camera (
![]()
![]() 1160-1980).
In order to insure that image wandering could not contribute significantly
to errors, all observations for this atlas were made through the GHRS
Small Science Aperture.
Aside from being a spectral standard (Walborn 1972), 10 Lac is an ideal
object for calibrating the wavelength scale. 10 Lac is an apparently single
star, and its spectrum has numerous sharp photospheric lines. Fullerton (1990)
found no measurable variations over time to a precision of perhaps
± 1
km s-1. In addition to plotted specta, the Brandt et al. atlas gives
measured wavelengths of over 700 lines, which can be compared
to published laboratory values.
1160-1980).
In order to insure that image wandering could not contribute significantly
to errors, all observations for this atlas were made through the GHRS
Small Science Aperture.
Aside from being a spectral standard (Walborn 1972), 10 Lac is an ideal
object for calibrating the wavelength scale. 10 Lac is an apparently single
star, and its spectrum has numerous sharp photospheric lines. Fullerton (1990)
found no measurable variations over time to a precision of perhaps
± 1
km s-1. In addition to plotted specta, the Brandt et al. atlas gives
measured wavelengths of over 700 lines, which can be compared
to published laboratory values.![]() This information is adequate to permit the determination of an effective
mean velocity of the IUE SWP camera relative to ground-based velocity
measurements of 10 Lac (Hobbs 1969, Grayzeck & Kerr 1974, Stokes 1978).
This information is adequate to permit the determination of an effective
mean velocity of the IUE SWP camera relative to ground-based velocity
measurements of 10 Lac (Hobbs 1969, Grayzeck & Kerr 1974, Stokes 1978).
b) The Procedure
In this subsection we will link the apparent velocities of SWP LGAP spectra of 10 Lac to the laboratory system. Because this connection takes several steps, we will first outline them and then discuss the actual cross-correlation results:
Step 1, ![]() RVSWP =
RVSWP-LGAP - RVSWP-SMAP:
RVSWP =
RVSWP-LGAP - RVSWP-SMAP:
This is a velocity correction for unpredicted difference in wavelengths of lines measured in IUE spectra taken through the large aperture relative to the small aperture. Such errors might arise from potential measurement error between the apertures or (more likely) from changes in the FES reference position used for target acquisition.
Step 2, ![]() RVIUE =
RVIUE = ![]() RVSWP-LGAP -
RVGHRS:
RVSWP-LGAP -
RVGHRS:
This term is the instrument-to-instrument correction for the SWP/SMAP wavelength zero-point referred to the zero-point of the GHRS (small-aperture) atlas of 10 Lac.
Step 3, ![]() RVUV =
RVUV = ![]() RVGHRS -
RVlab:
RVGHRS -
RVlab:
This correction accounts for any difference between the
radial velocity derived from differences in the measured (GHRS) and
laboratory wavelengths. These could result from an error in the calibration
of the GHRS. We note in particular that the Brandt et al. wavelengths
of photospheric lines in 10 Lac were measured from mainly iron-group element
lines whereas the calibration
of wavelengths for the GHRS systems was derived from Pt line
wavelengths. ![]()
Step 4, ![]() RVstar = RVlab -
RVstar = RVlab -
![]() RVoptical:
RVoptical:
The final step is the correction for the star's adopted heliocentric radial velocity from ground-based measurements. The ground-based value can be compared finally to the velocity obtained from appying Steps 1-3. In our chain of comparisons, the defining reference is the radial velocity of 10 Lac ( -9.7 km s-1; Wilson 1953). The addition of the results from Steps #1-4, 1 + 2 + 3 + 4, gives the net discrepancy between the SWP LGAP and the laboratory wavelengths.
c) Comparison with 10 Lacertae Atlas
Analysis for Step 1, ![]() RVSWP (correction from
IUE large to small aperture):
RVSWP (correction from
IUE large to small aperture):
In ![]() 3 we showed that
SWP camera data for several
bright hot stars do not have discernible velocity trends with time.
As Figure 10 shows, the test star, 10 Lac, is no exception.
The mean aperture-to-aperture difference from all available 10 Lac
spectra is
3 we showed that
SWP camera data for several
bright hot stars do not have discernible velocity trends with time.
As Figure 10 shows, the test star, 10 Lac, is no exception.
The mean aperture-to-aperture difference from all available 10 Lac
spectra is ![]() RVSWP = +0.4 km s-1.
At +1.2 km s-1
± 0.8 km s-1, this value differs slightly
from the average velocity discrepancy for 12 stars represented in
Table 1.
RVSWP = +0.4 km s-1.
At +1.2 km s-1
± 0.8 km s-1, this value differs slightly
from the average velocity discrepancy for 12 stars represented in
Table 1.
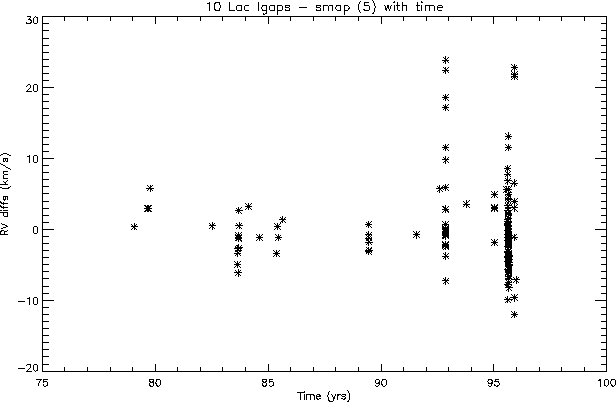 Figure 10
Large-aperture - Small-aperture SWP apparent radial velocities
of 10 Lac during the lifetime of the IUE. The sample comprises
145 LGAP images and is referred to the average of 6 SMAP images.
The large scatter among velocities at late epochs is likely due to acquisition
of the star at a different position in the FES.
This diagram shows that the
instrumental SWP velocities of 10 Lac exhibit no significant trend with
time. Error bars are taken from Fig. 11.
As an important digression, we should add that we have searched
for nonrandom positionings of the image of 10 Lac
within the LGAP. Figure 11 exhibits the histogram of the
SWP/LGAP sample of spectra. The centroid of this distribution is
arbitrarily set to zero. If one first fits the distribution to a single
gaussian, the r.m.s. dispersion is 4 km s-1. A more convincing
representation is a bimodal gaussian (see Figure
11) with
![]() 1,
1,
![]() 2
= 2.8 km s-1 per observation.
The corresponding errors in the
means of the two peaks are 0.5 km s-1 and
± 1.2 km s-1,
respectively. Investigation of the times of the
observations shows that most of the secondary peak
arises from spectra taken in 1993 and 1995, when different aperture
reference points were used to acquire the star. It is possible that
target acquisitions at other reference points may be reason for the
skewed high-velocity tail of the distribution.
2
= 2.8 km s-1 per observation.
The corresponding errors in the
means of the two peaks are 0.5 km s-1 and
± 1.2 km s-1,
respectively. Investigation of the times of the
observations shows that most of the secondary peak
arises from spectra taken in 1993 and 1995, when different aperture
reference points were used to acquire the star. It is possible that
target acquisitions at other reference points may be reason for the
skewed high-velocity tail of the distribution.
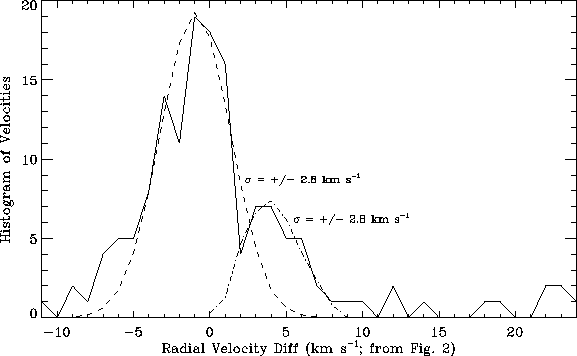 Figure 11
Velocity histogram for radial velocities for 10 Lac taken from
Figure 10. This distribution is essentially bimodal, reflecting
two sets of target centerings for late epoch observations.
Departures from gaussian distributions are common among apparent velocities
found from our large data samples, and the extended negative and positive
tails that they represent in a histogram seem to be present equally.
It may be significant that the distribution of cross-correlation shifts
taken from the 1996 data series for ![]() Per, with the sinusoidal
component removed, generally follows a gaussian distribution and in
particular has no extended tails. This fact suggests that the effective
position of the star image in the aperture is the primary reason for
outlying velocities in our cross-correlation results. In this picture
the initial exposures of a target in a time sequence are likely to exhibit
a large scatter because the telescope temperature and focus had not yet
equilibriated. After an hour or two the error distribution of the remaining
observations became tighter and also more closely resembled a gaussian.
Per, with the sinusoidal
component removed, generally follows a gaussian distribution and in
particular has no extended tails. This fact suggests that the effective
position of the star image in the aperture is the primary reason for
outlying velocities in our cross-correlation results. In this picture
the initial exposures of a target in a time sequence are likely to exhibit
a large scatter because the telescope temperature and focus had not yet
equilibriated. After an hour or two the error distribution of the remaining
observations became tighter and also more closely resembled a gaussian.
Analysis for Step 2, ![]() RVIUE
(correction from IUE to GHRS):
RVIUE
(correction from IUE to GHRS):
Cross-correlation shifts were computed as before among 41 spectral
orders in six SWP SMAP echellograms against the Brandt et al. atlas of
10 Lac. These shifts are indicated by the solid line in
Figure 12.
The average, ![]() RVIUE, is +0.6 km s-1, while the r.m.s.
error per observation is
± 1.5 km s-1. This gives an
error in the mean velocity determination of
± 0.2 km s-1.
This value is negligible compared to errors from the other steps.
RVIUE, is +0.6 km s-1, while the r.m.s.
error per observation is
± 1.5 km s-1. This gives an
error in the mean velocity determination of
± 0.2 km s-1.
This value is negligible compared to errors from the other steps.
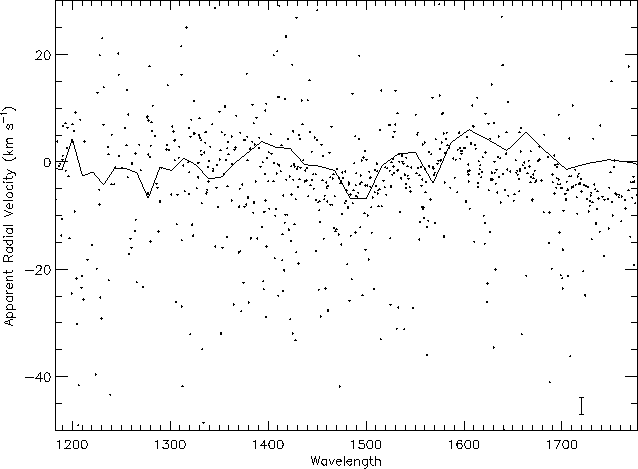 Figure 12
Differences of GHRS - IUE (jagged line) and GHRS -
laboratory (points) wavelengths for photospheric lines of 10 Lac as a
function of wavelength. The GHRS - IUE differences refer to
cross-correlation shifts between lines in the 10 Lac atlas and in a group
of 145 high-dispersion SWP echellograms. The GHRS - Lab
differences have been shifted by +16 km s-1 to account for the combined
radial velocity of the star and an instrumental error of the GHRS
relative to the laboratory system. Error bars in the lower right are for the
jagged line and refer to the mean difference between adjacent SWP
echelle orders.
Analysis for Step 3, ![]() RVUV (correction from
GHRS to laboratory system):
RVUV (correction from
GHRS to laboratory system):
Brandt et al. (1998) selected 24 photospheric lines from the total sample
of 705 lines they identified in their atlas and measured a mean velocity
difference of -7 km s-1 with respect to laboratory wavelengths in the
literature. However, these authors did not specify which lines they used.
We have compared the wavelengths of the entire dataset and find instead a
mean velocity difference of -11.6 km s-1. We repeated this comparison by
taking a number of subsamples of lines. These differences were found to lie
always within
± 2 km s-1 of the latter value. We adopt this value
for ![]() RVUV.
RVUV.
Analysis for Step 4, ![]() RVstar (correction for
10 Lac's heliocentric radial velocity):
RVstar (correction for
10 Lac's heliocentric radial velocity):
The optical catalog radial velocity value for 10 Lac is -9.7 km s-1 and requires no discussion. The sign of this radial velocity will be reversed below to refer the velocity system to the GHRS scale. From the agreement of values for this star from different instruments in the literature, a reasonable error for the optical determination is ± 1 km s-1.
In summary, the combination of the four velocities gives a net error of = +0.4 + 0.6 -11.6 + 9.7 = -0.9 ± 3.5 km s-1. This is the computed discrepancy for all measured photospheric wavelengths of 10 Lac from SWP LGAP observations referenced to the UV laboratory wavelengths used in the Brandt et al. study. The error of ± 3.5 km s-1 is the sum added in quadrature of the values given for each of the above four steps. This mean discrepancy appears as the first entry in Table 3 and is the key single result of this paper.