Go to the
MAST Discovery Portal. Use the pull down menu under Select a Collection to
choose the HSC (blue).
Enter (you can just cut and paste if you like) the coordinates and search
radius (i.e. 05:38:42.3 -69:06:03.1 r=50s) in the Search
box (green).
Perform the search by
hitting a carriage return or by clicking on the
 icon (orange).
The results
are displayed in the List of Objects, while the AstroView window shows the
objects against the DSS image.
The left column is a series of Filters that can be used to refine
the data selected. Note the third item has the
icon (orange).
The results
are displayed in the List of Objects, while the AstroView window shows the
objects against the DSS image.
The left column is a series of Filters that can be used to refine
the data selected. Note the third item has the
 icon
which indicates there are spectroscopic observations of that object.
icon
which indicates there are spectroscopic observations of that object.
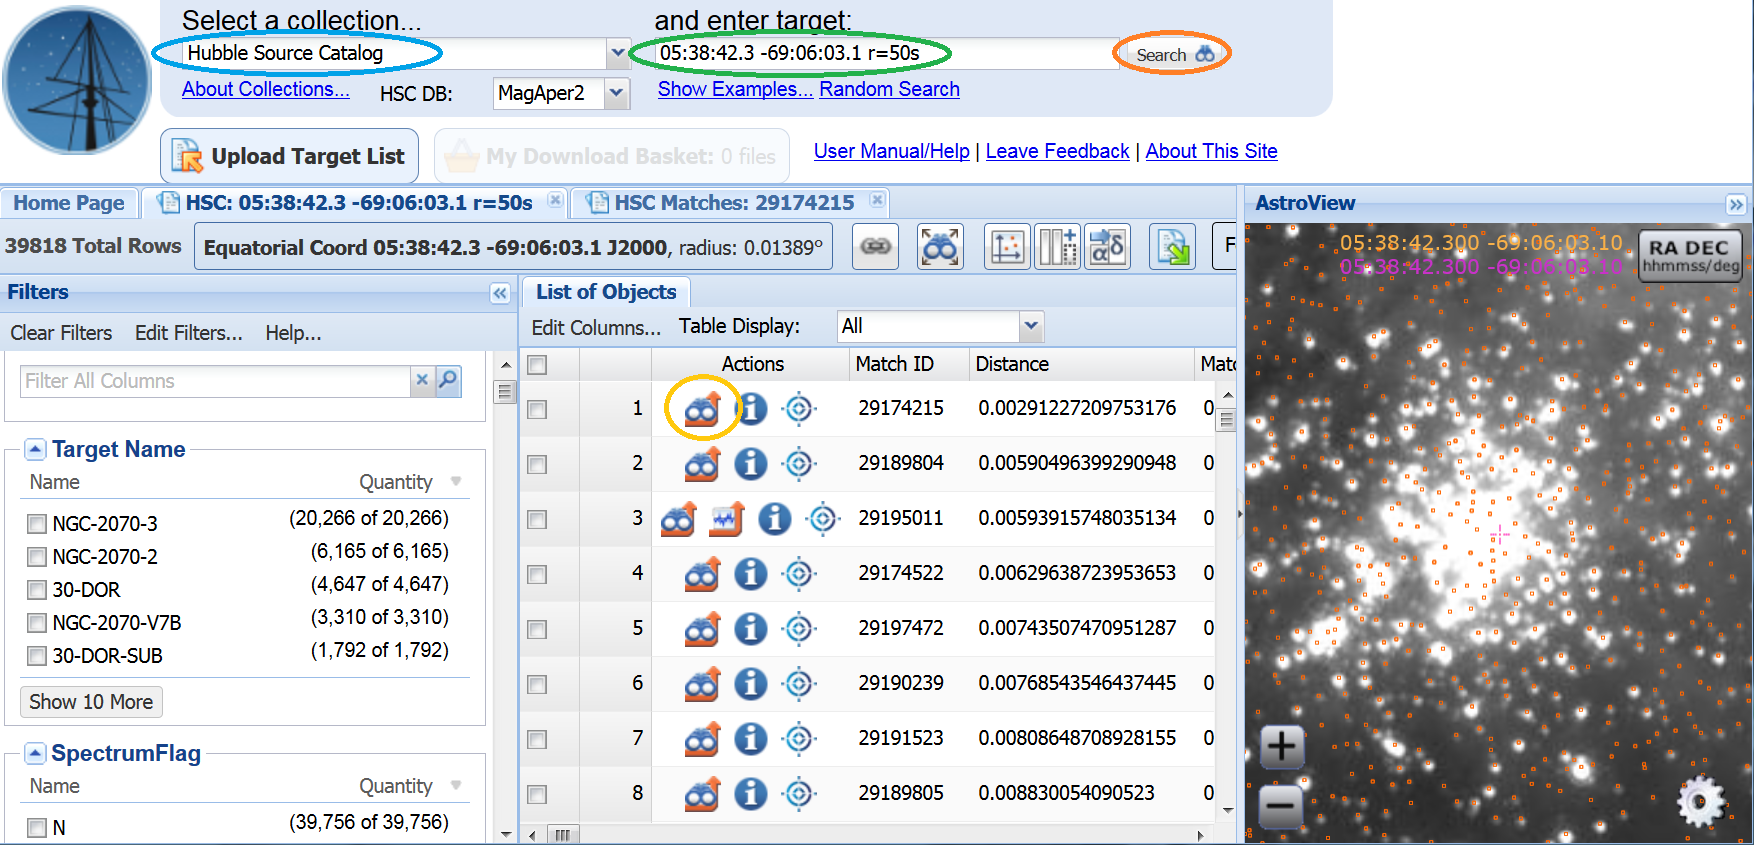
At this point, you may want to look directly at the HST data.
This can be done by clicking on the Load Detailed Results
 icon (yellow) under Actions,
and then clicking on the Toggle Overlay Image
icon (yellow) under Actions,
and then clicking on the Toggle Overlay Image
 icon (see
Use Case 1 for details).
icon (see
Use Case 1 for details).
Note that you can use the HLA Interactive Display to get a better
view of the field (e.g. by changing the contrast level), which will
allow you to better identify specific sources. After clicking on the
Load Detailed Results
icon, click on the Preview image.
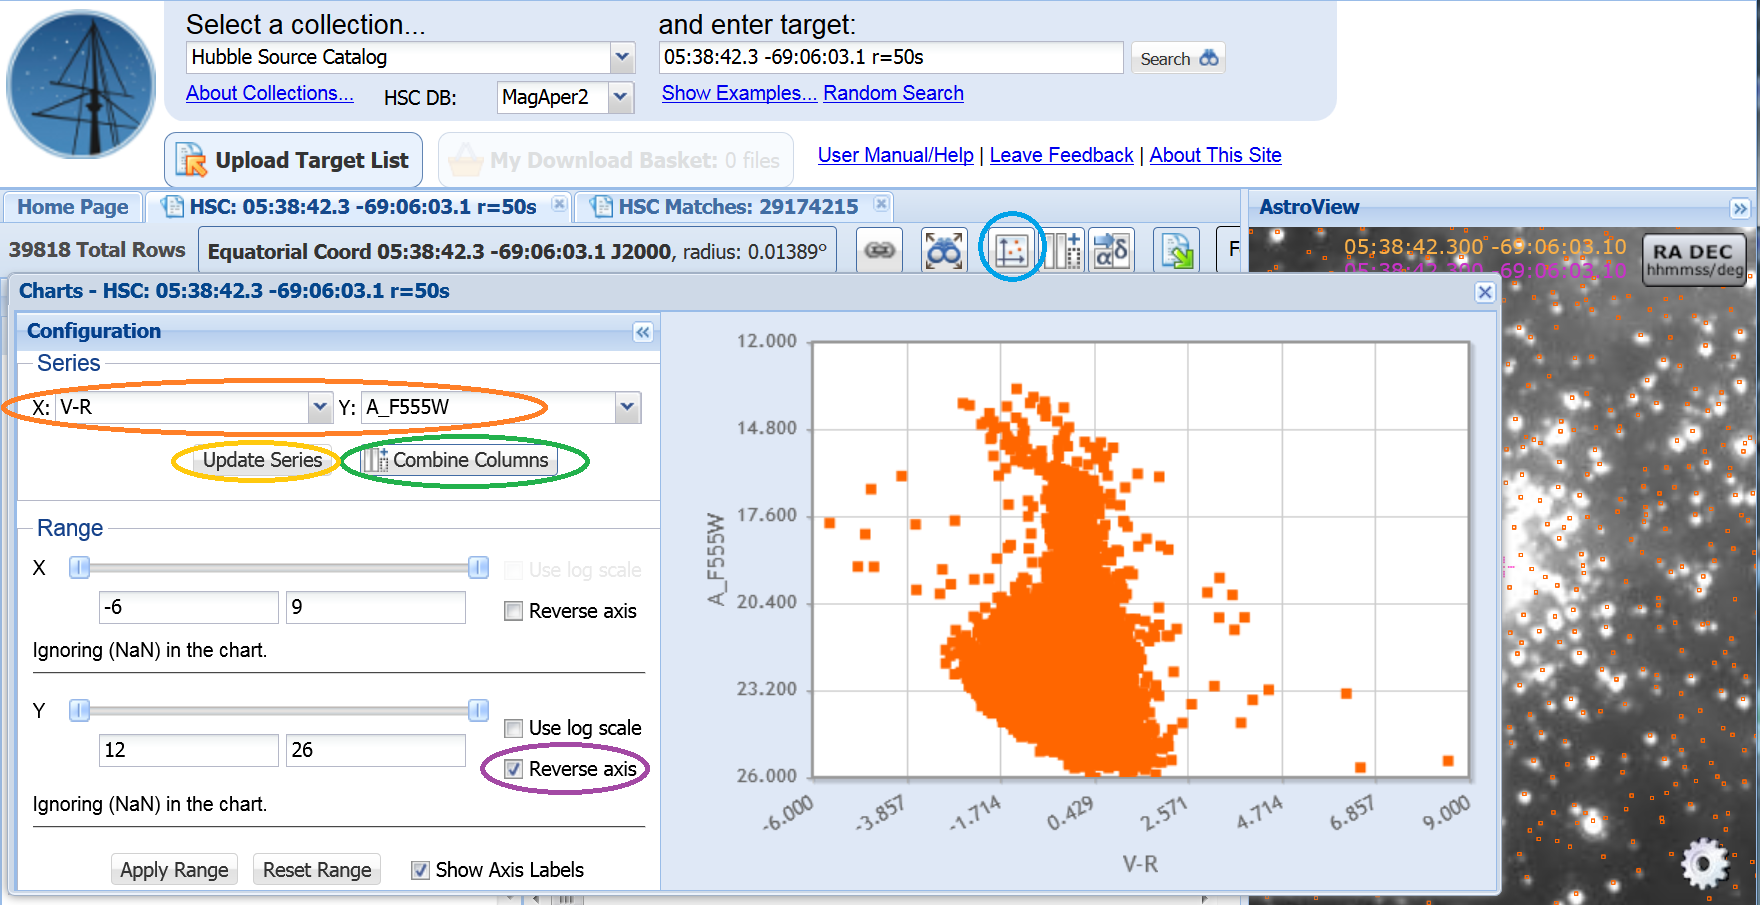
Make a plot by clicking the  icon (blue);
remember to return to the Home Page (i.e., HSC: 05:38 ...) if
you placed an HST image in AstroView. Under
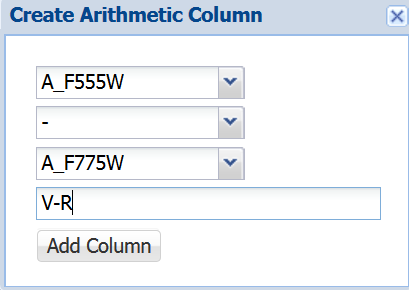
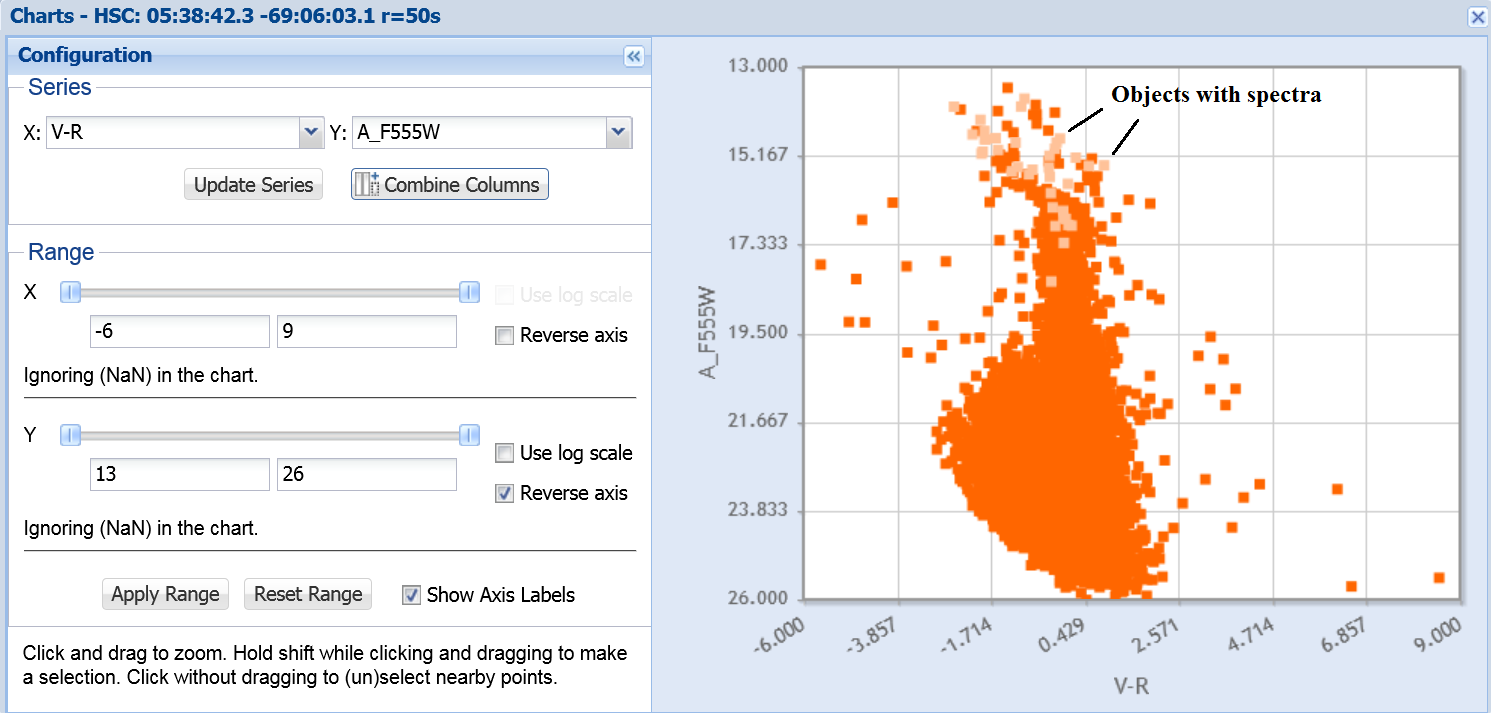
Configuration, make a V-R (A_F555W-A_F775W) column by using the
Combine Columns option (green).
icon (blue);
remember to return to the Home Page (i.e., HSC: 05:38 ...) if
you placed an HST image in AstroView. Under
Configuration, make a V-R (A_F555W-A_F775W) column by using the
Combine Columns option (green).
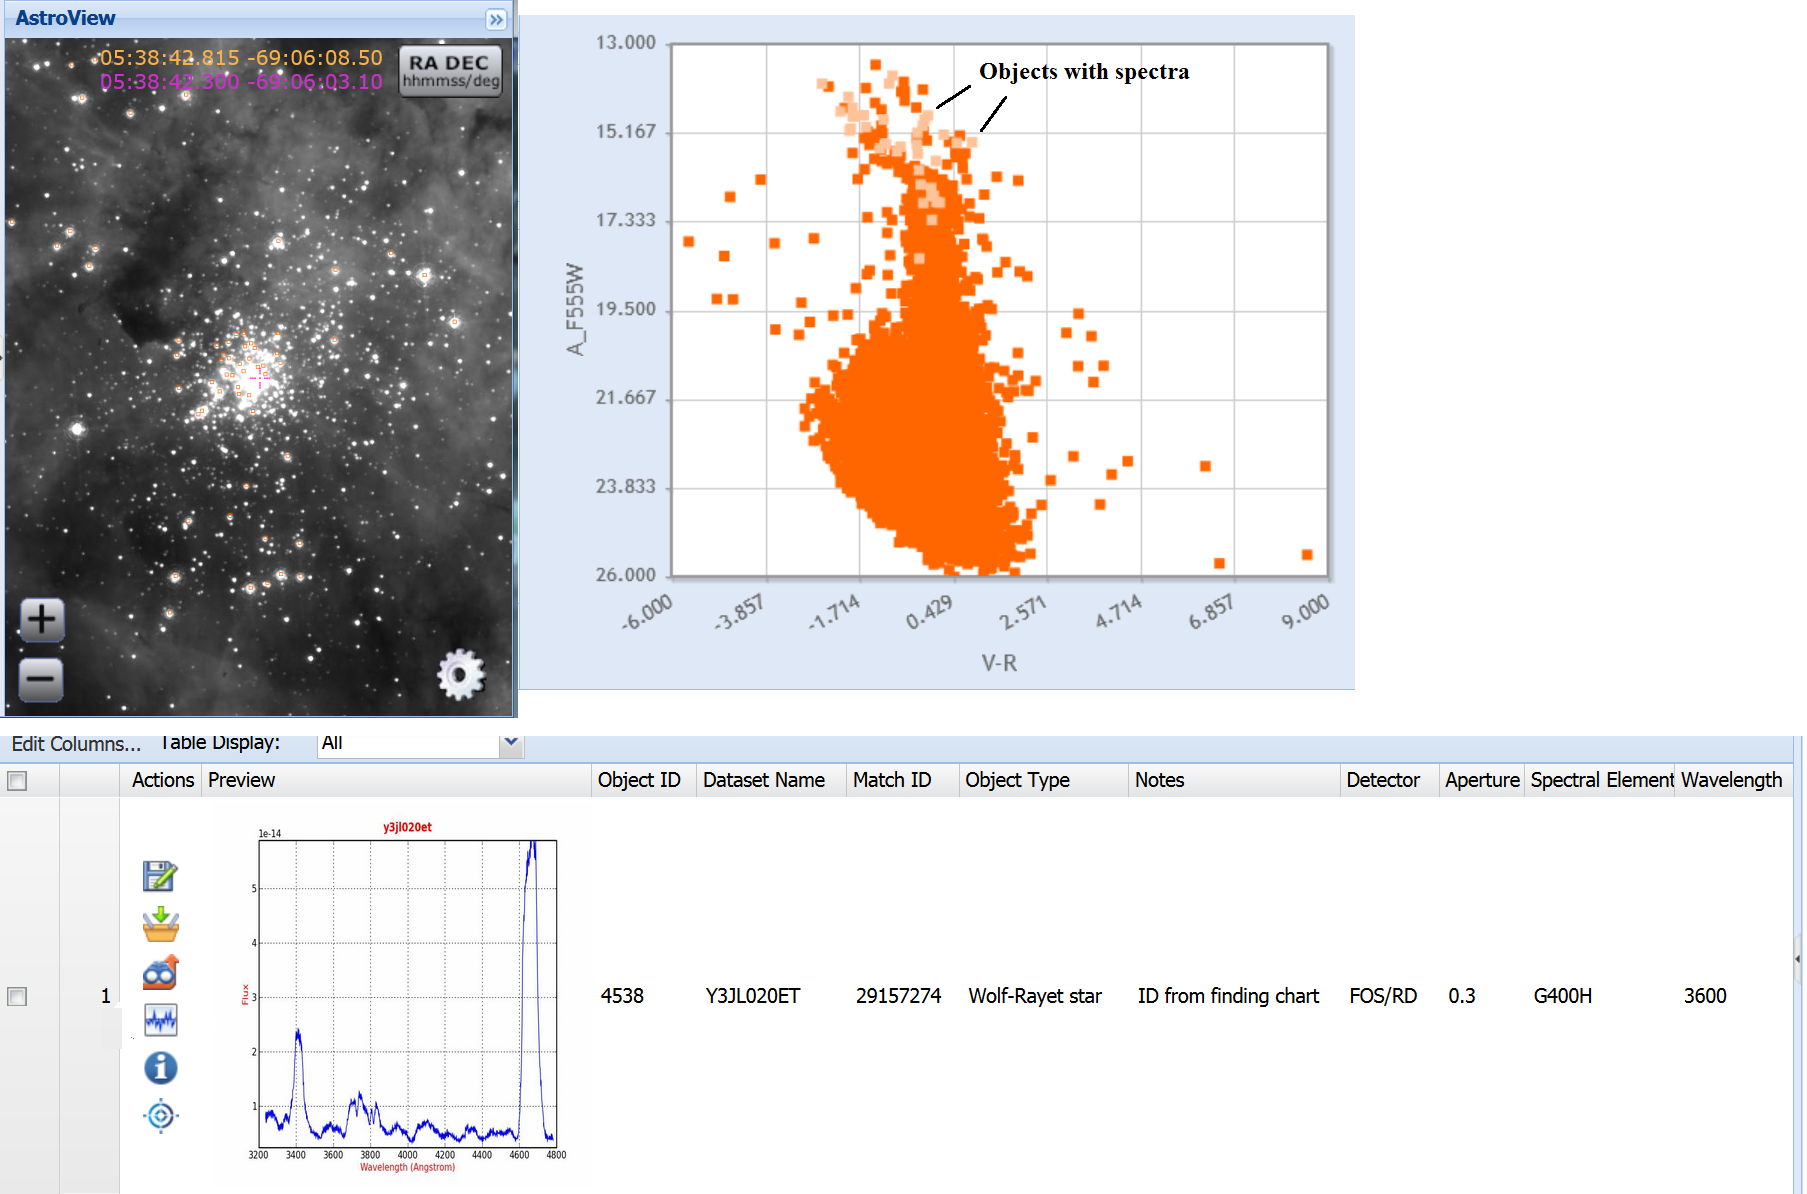
Next, select X = V-R and Y = A_F555W (orange). Click on the Update Series button (yellow) to plot the CMD. Reverse the Y axis to have magnitudes go from bright to faint (purple).
In the Filters area, look under the Spectrum Flag to see that there are
62 objects with spectra (blue).
Click on "Y" to filter on those objects
(green). Zoom out in Astroview to see
all the objects. Note that the
icon in the Actions area
(orange) indicate spectral data is
available (which we will examine in Step 5).
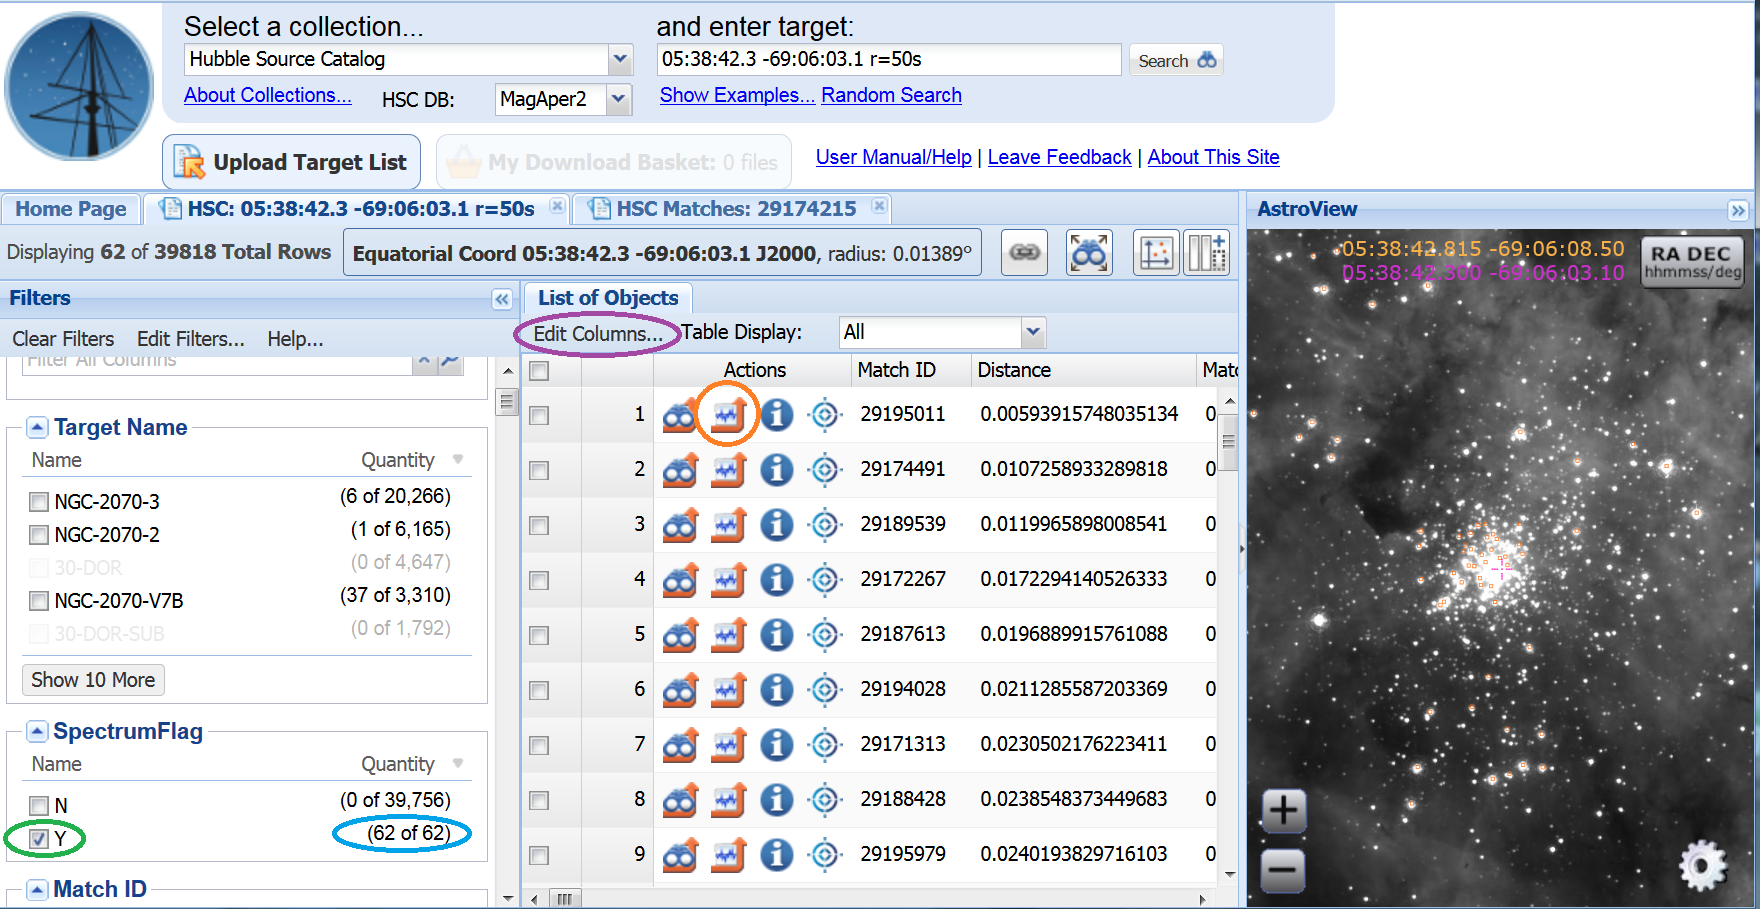
Click on the Edit Columns box to select all these objects in the List of Objects (purple in the previous figure). Deselect the Spectrum Flag in the Filters area (so that all objects will appear in the CMD) and hit Update Series and reset the plotting range. The objects with spectra are now highlighted.
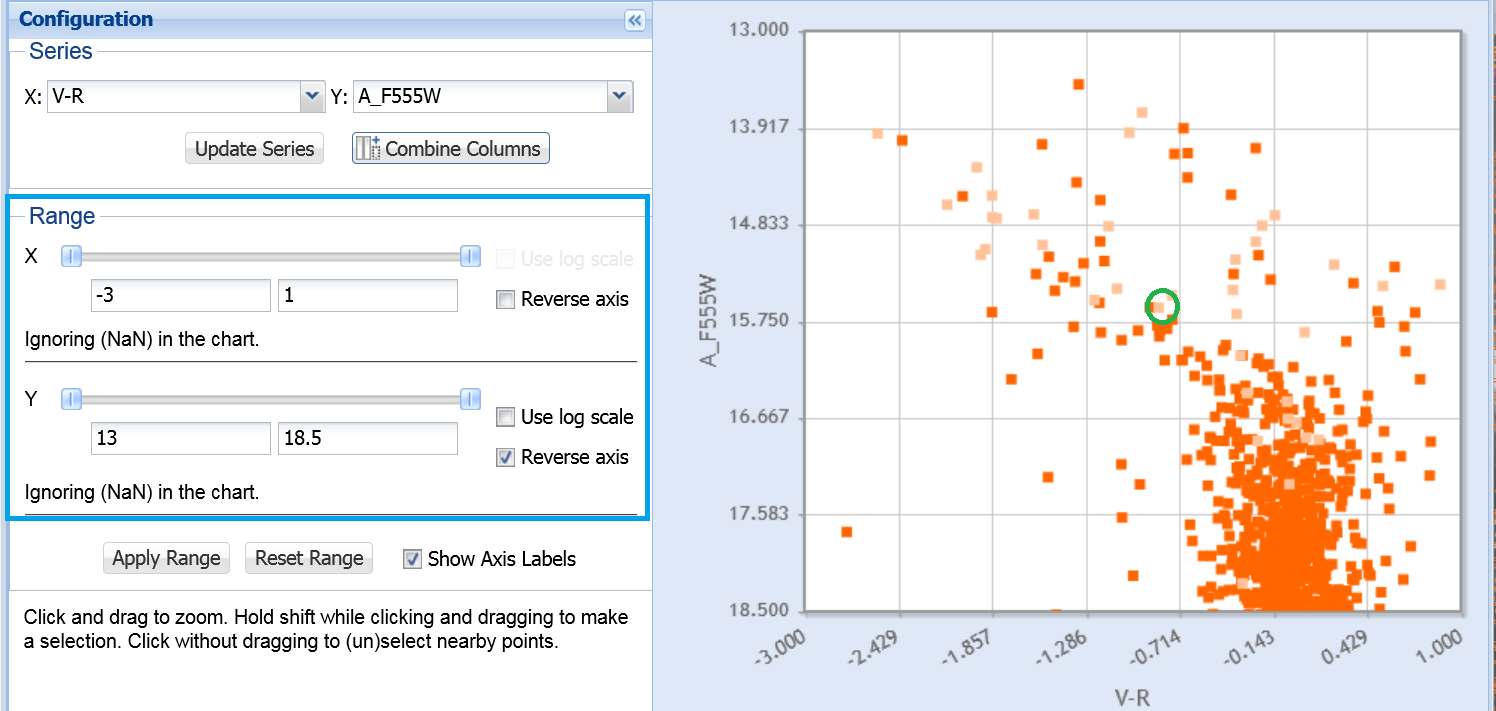
Start by expanding the plot to only show the region containing stars with spectra (blue). Select an object of interest (green), deselect it and reselect it in the plot.
Go back to the search results page and see that the object is now at the bottom of the list. Use the bullseye (blue) to center the object in Astroview ((green).
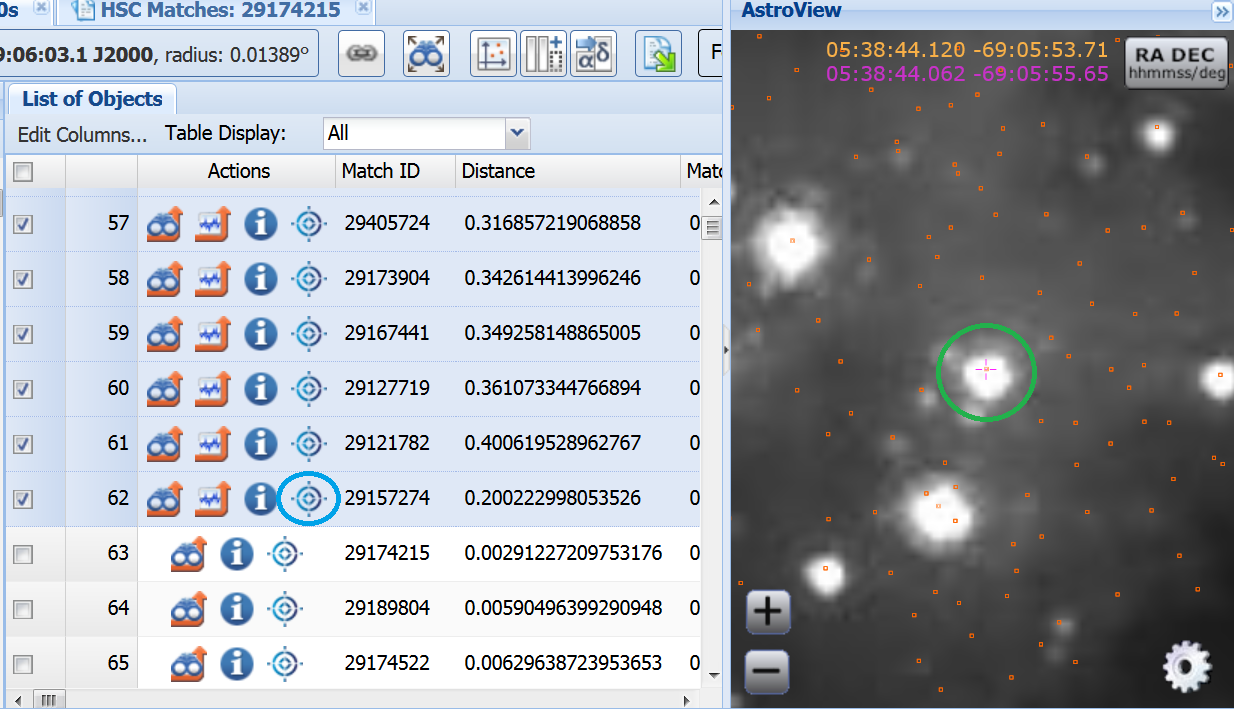
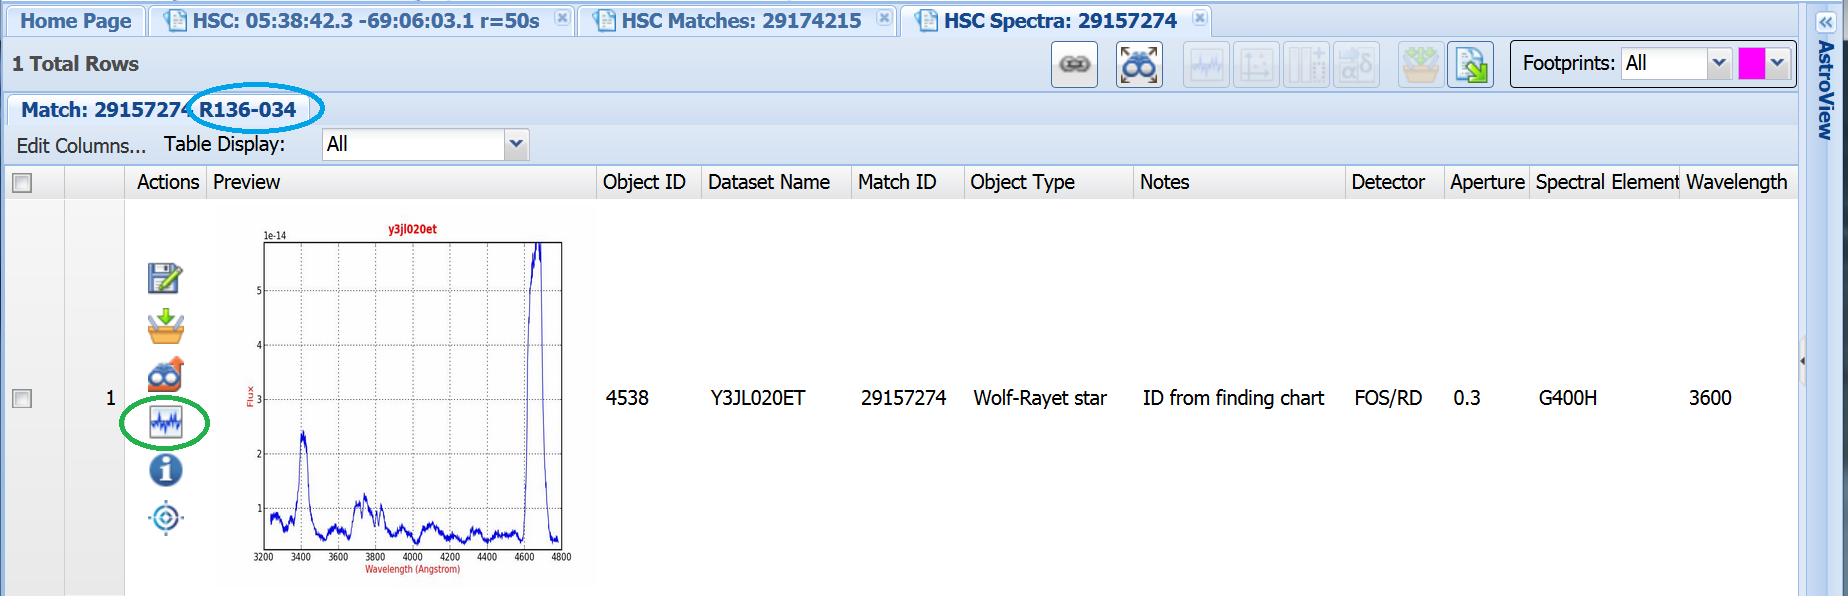
To examime the spectrum of the object, click on the
icon
(orange in Step 3).
See the FAQ (link) for the column definitions. Note that the target name is given in the Tab name (blue).
Clicking on the  icon
(green)
will bring up an interactive spectrum viewer.
icon
(green)
will bring up an interactive spectrum viewer.
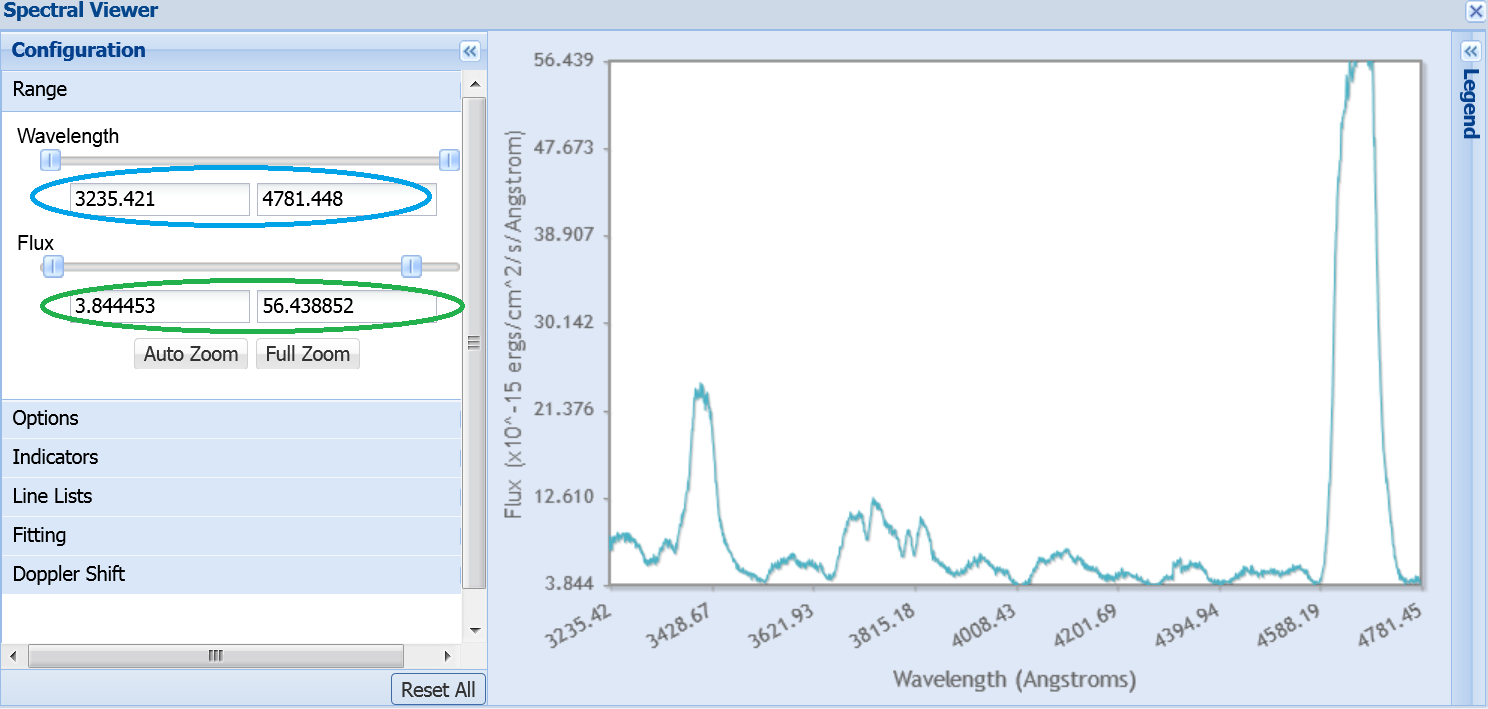
You can change the Wavelength (blue). and Flux (green) scales under Range in the Configuration menu.
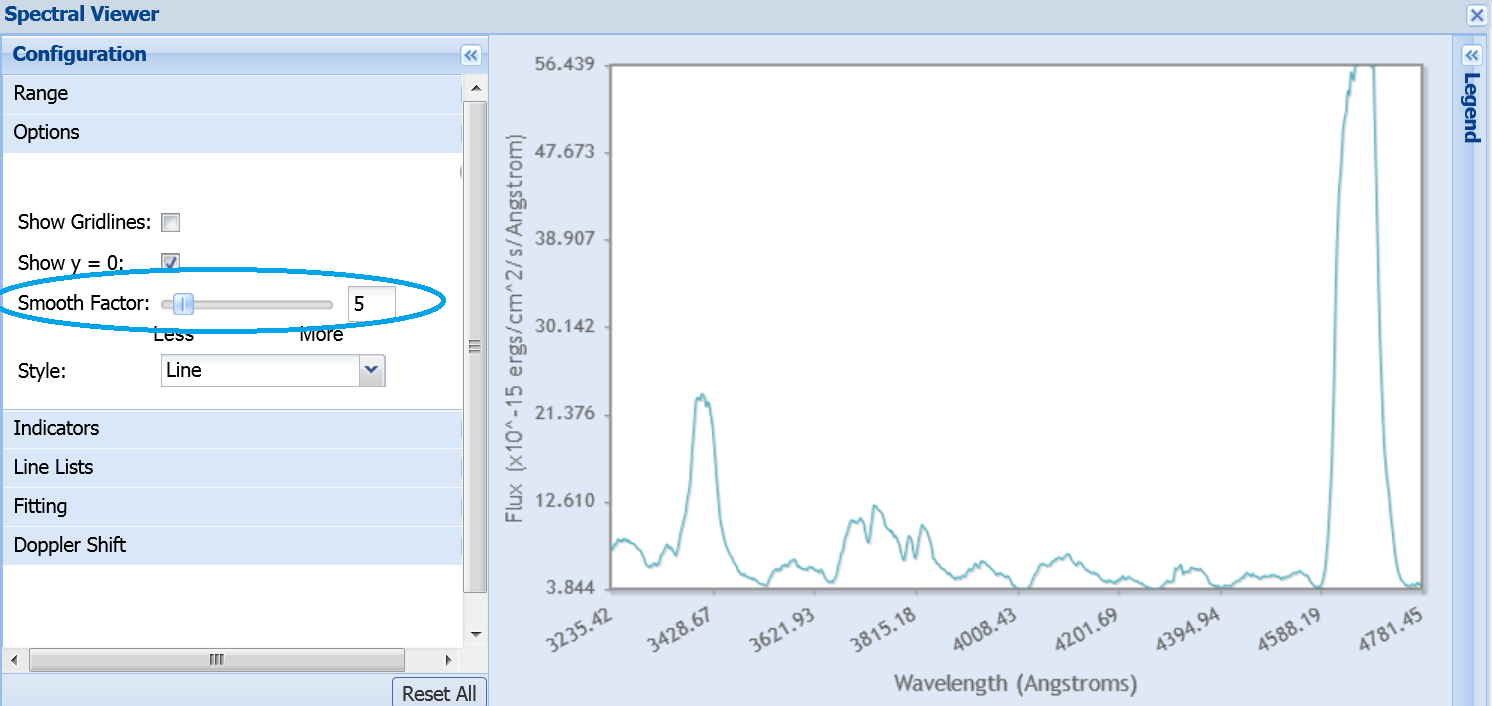
Under Options, you can smooth the spectrum (blue).
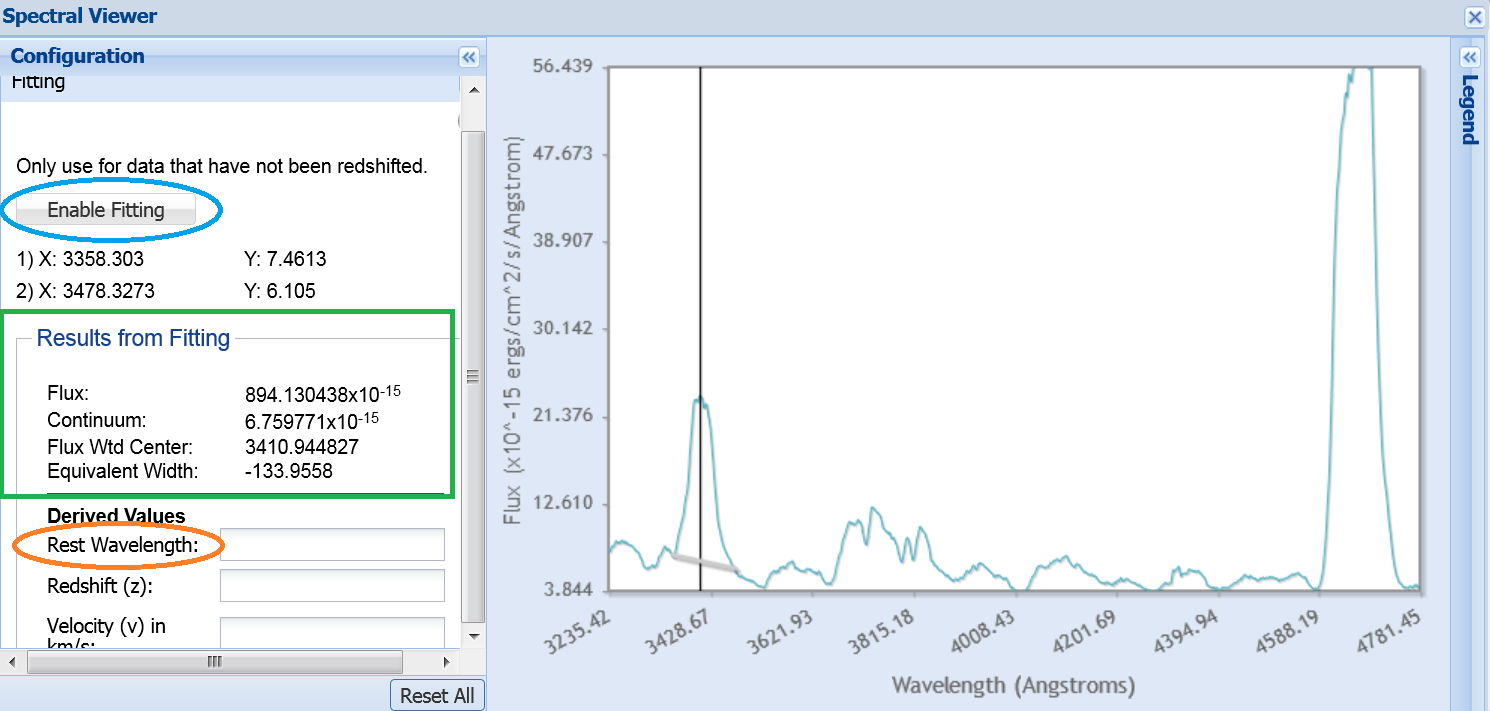
Under Fitting, you can measure the equivalent width of a feature. First, click on the Enable Fitting (blue) button (which changes to Disable Fitting), and then place your cursor on the left then the right of the line. The center of the line is marked in the plot, and the results of the fitting are shown (green). If you are measuring an extragalactic object, you can put the rest wavelength in the Rest Wavelength box (orange), and the redshift will be calculated based on the measured value. To save the measurements, you can highlight the results with your cursor and use the copy and paste function into a separate file.
For more information on using the Spectral Viewer, see MAST Discovery Portal Spectral Viewer help.