In the inventory you will see properties of the individual images such as RA and Dec, Image ID, which filter the image was taken with etc. These columns can can filtered by entering key words just below the table headings.
Start refining the results by entering ACS/WFC in the Detector field for ACS Wide Field Camera. This should take your 1726 results down to 259. Now enter *F814W* in the spectral_elt field (spectral element), where including the "wildcards" displays all images that include the text F814W.
Go into the images tab and enter the interactive display of the first image, HST_10543_01_ACS_WFC_F814W.
Click on the HSC (beta) check box to see all the HSC sources on this image (may take a short while).
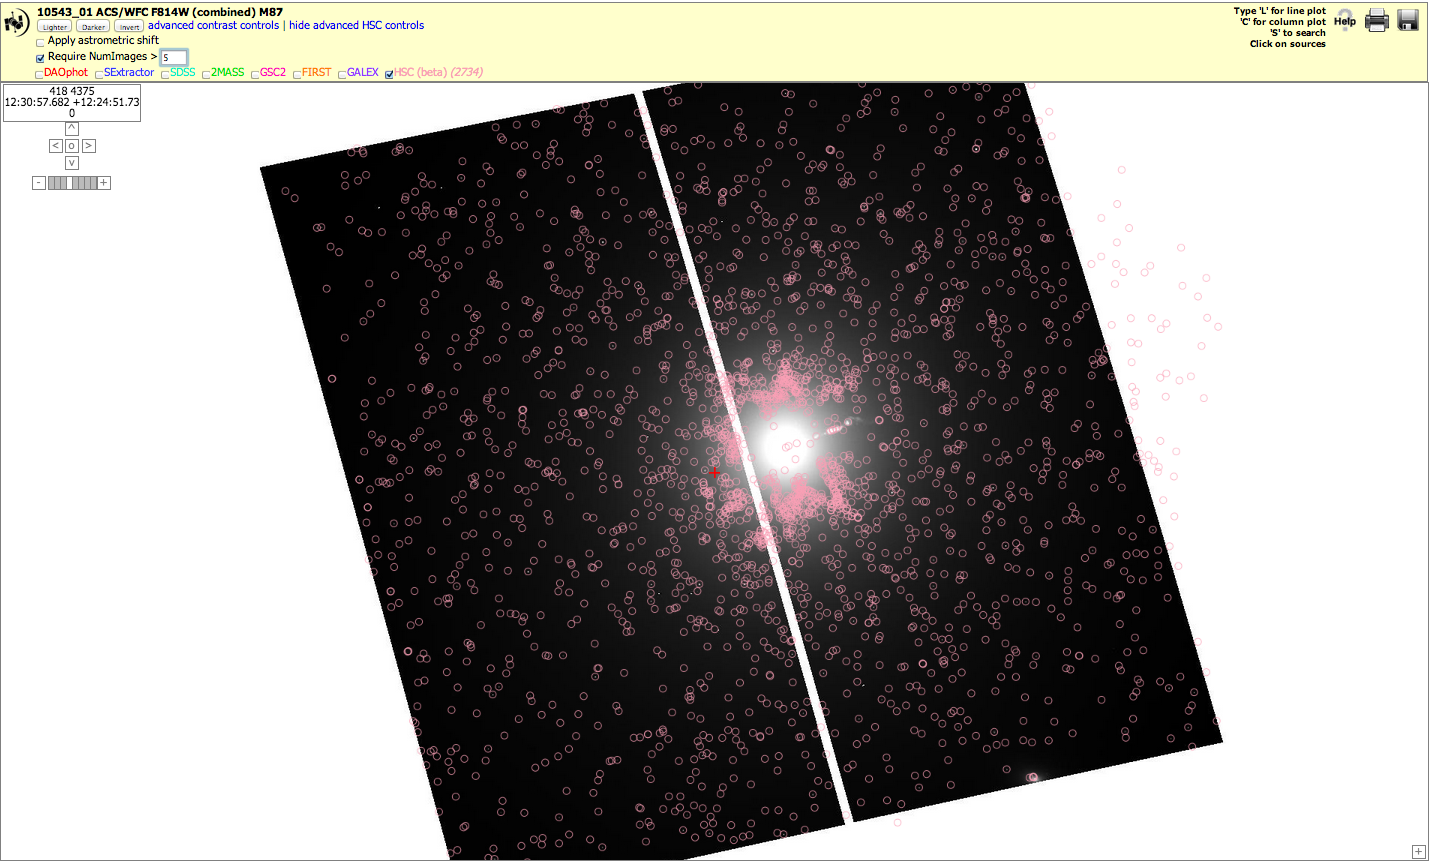
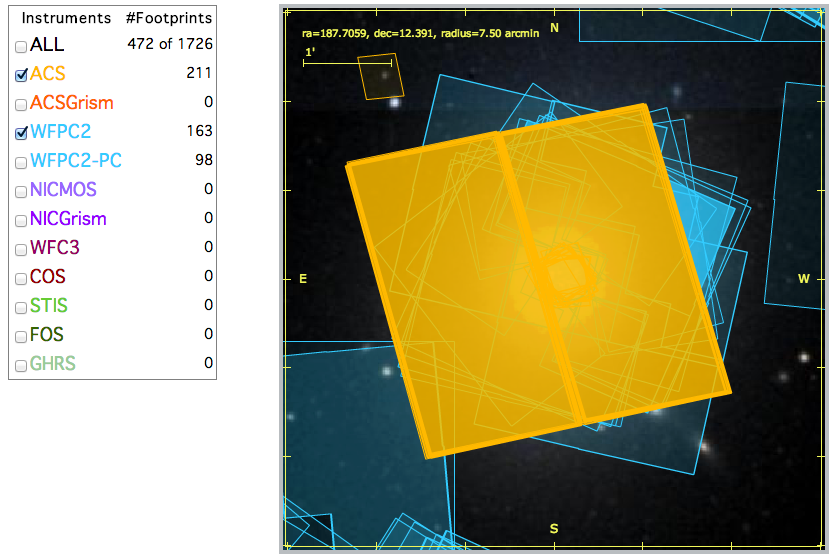
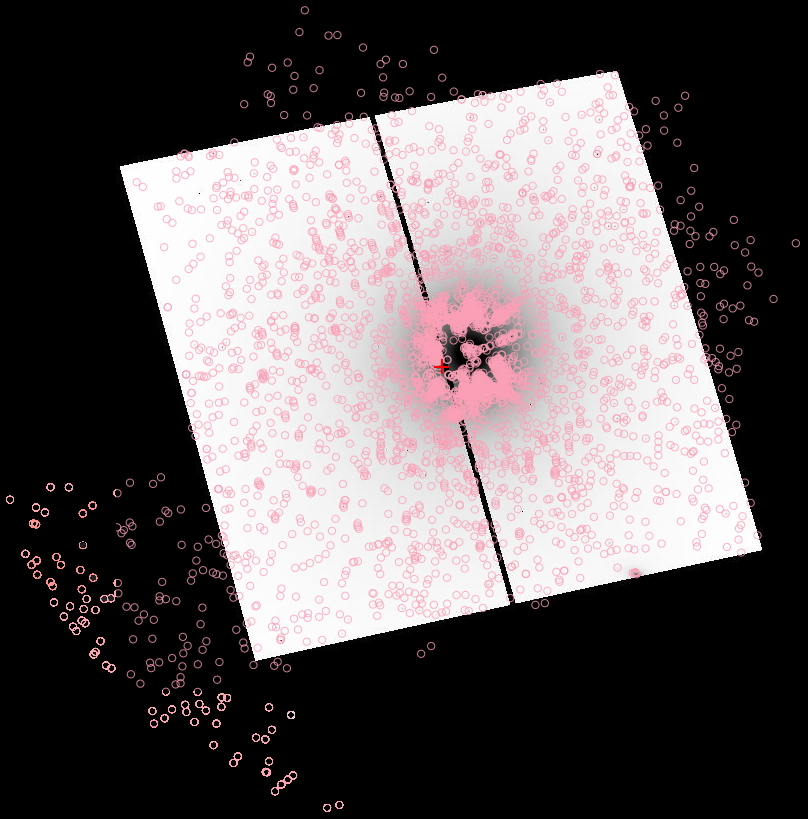
The HSC combines visit based source lists from all available WFPC2 and ACS/WFC data for a given field. Because of this however, the small possibility of having artifacts and occasional unmatched source readings becomes a very real possibility in the final combined image. To remove most of the false detections, enter 5 in the Require NumImages field, under the advanced HSC controls. Note that there are not many sources in the nucleus of M87. The current generation of ACS and WFPC2 SExtractor source lists have problems identifying soures in regions of high background. In addition, just outside of this region many false detections are present. See FAQ under the limitations section for further discussion of the effects of high background.
Clicking on a source brings up the HSC summary data. We can use the concentration index (the difference in magnitude of a source at a radius of 3 pixels to 1) to quantify the source's type of structure. The magnitude of the source for each filter is also found here (measured in ABMAG). The HSC gathers source photometry from a visit based method. As we will see later this imposes a limit on faint sources that can be detected relative to studies which combine images to form deep mosaics. Having data for each visit can be useful in cases such as studying the variability of sources.
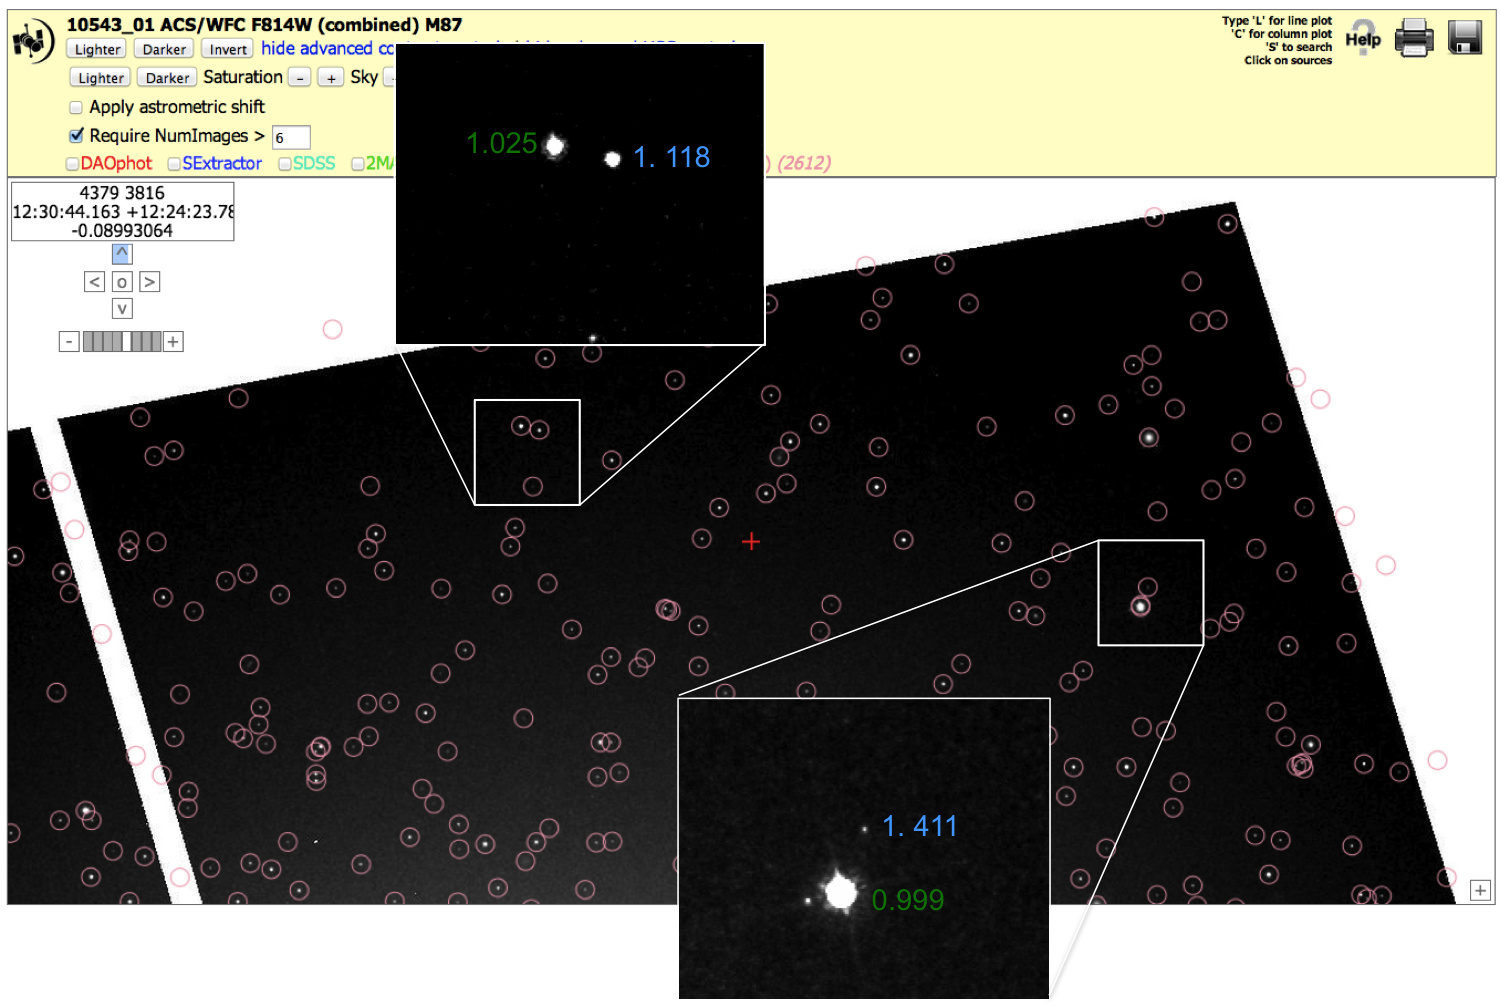
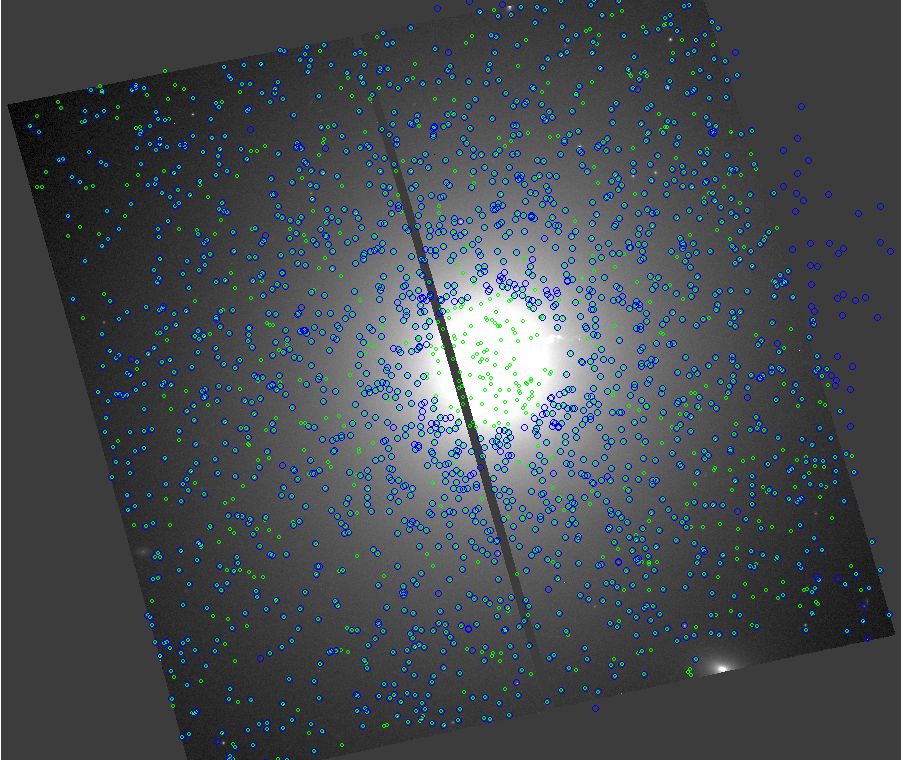
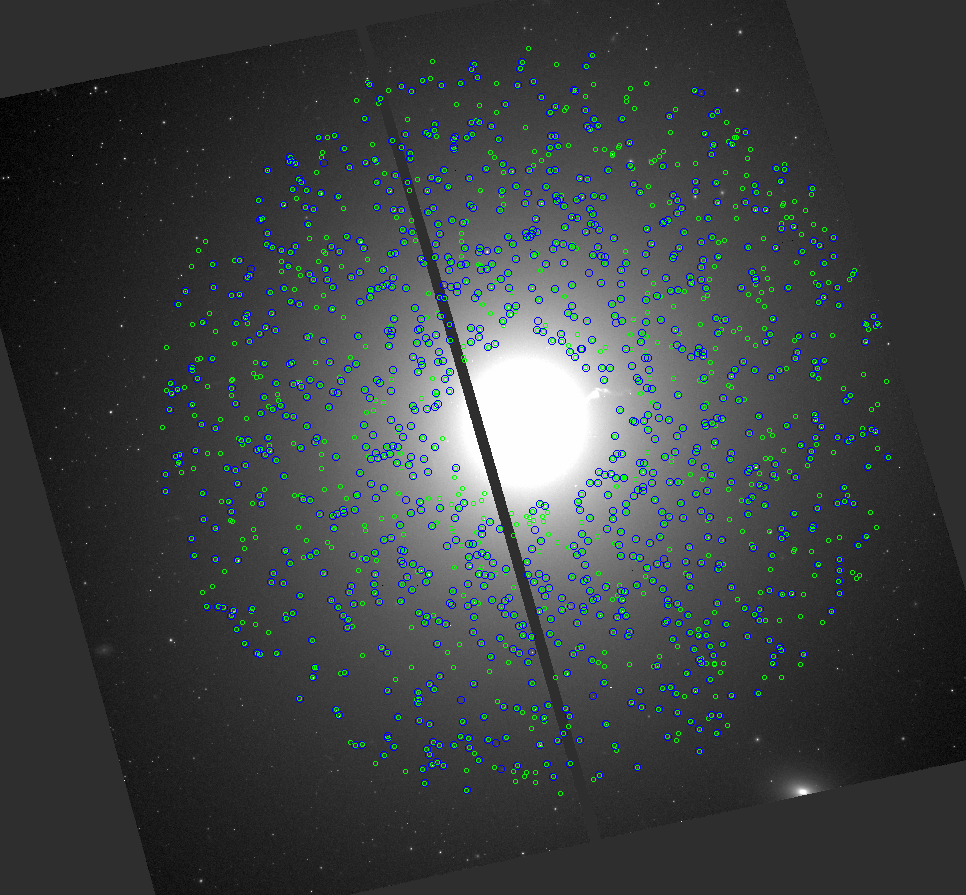
This image was constructed using additional software for illustrative purposes.
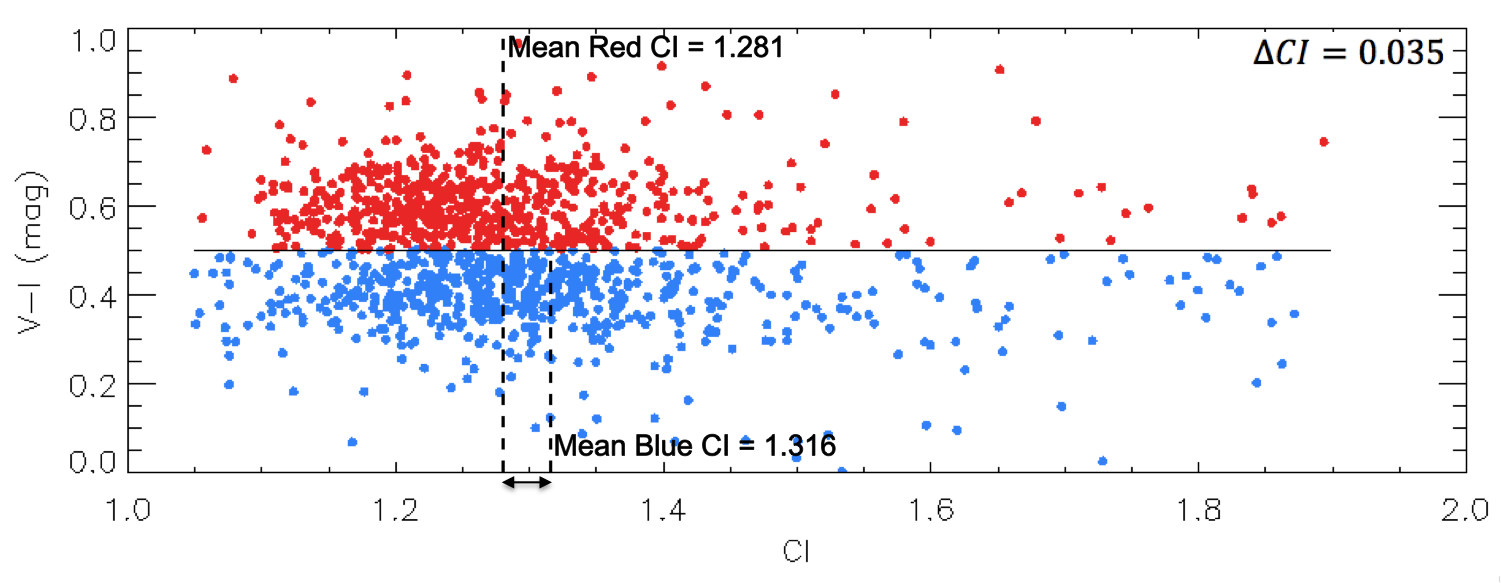
Highlighted are some point sources (green) as well as extended sources (blue) accompanied by their associated CI values. CI normally spans a range of 0.8 to 2.5 mag, where objects with CI ≲ 1.1 mag are point sources, CI ≳ 1.1 mag are extended sources.
Note that M87 is densely populated with GCs, there are only a few 10s of foreground stars and 1000s of GCs. A good technique to locate bright point sources by eye is to look for diffraction spikes like the star in the right most square section of the diagram or an Airy disk like the star in the top square.
Note also that these CI values are averages of all entries in the HSC (i.e. include all instruments and filters). There is no attempt to match the size of the aperture in terms of arc seconds for example. Different instruments have different scales (e.g. ACS is 0.05"/pix while the WFC chips of the WFPC2 have a scale of 0.10"/pix). Hence the resulting values that go into this average CI are very non uniform. The more specific CI values can be found in the detailed form in step 3.
Open up the Summary Form located on the HSCv3 homepage.
Use the following criteria:
Target Name = M87
Radius = 5 (arcmin)
Mag Type = MagAper2
NumImages > 5
Maximum records = 5001
Radius = 5 (arcmin)
Mag Type = MagAper2
NumImages > 5
Maximum records = 5001
and hit search.
The table displayed contains all the information from tens of visits for each source conveniently located in one table.
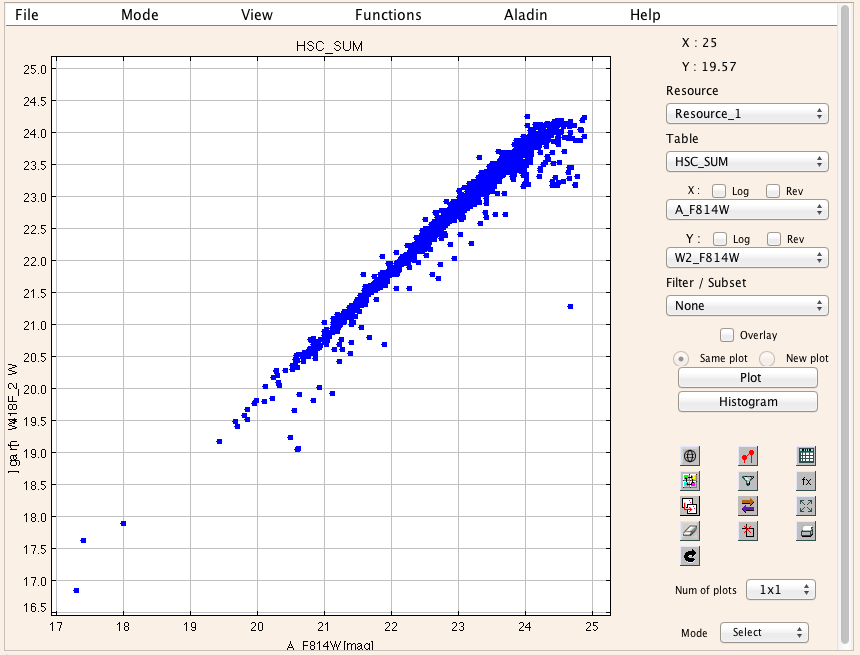
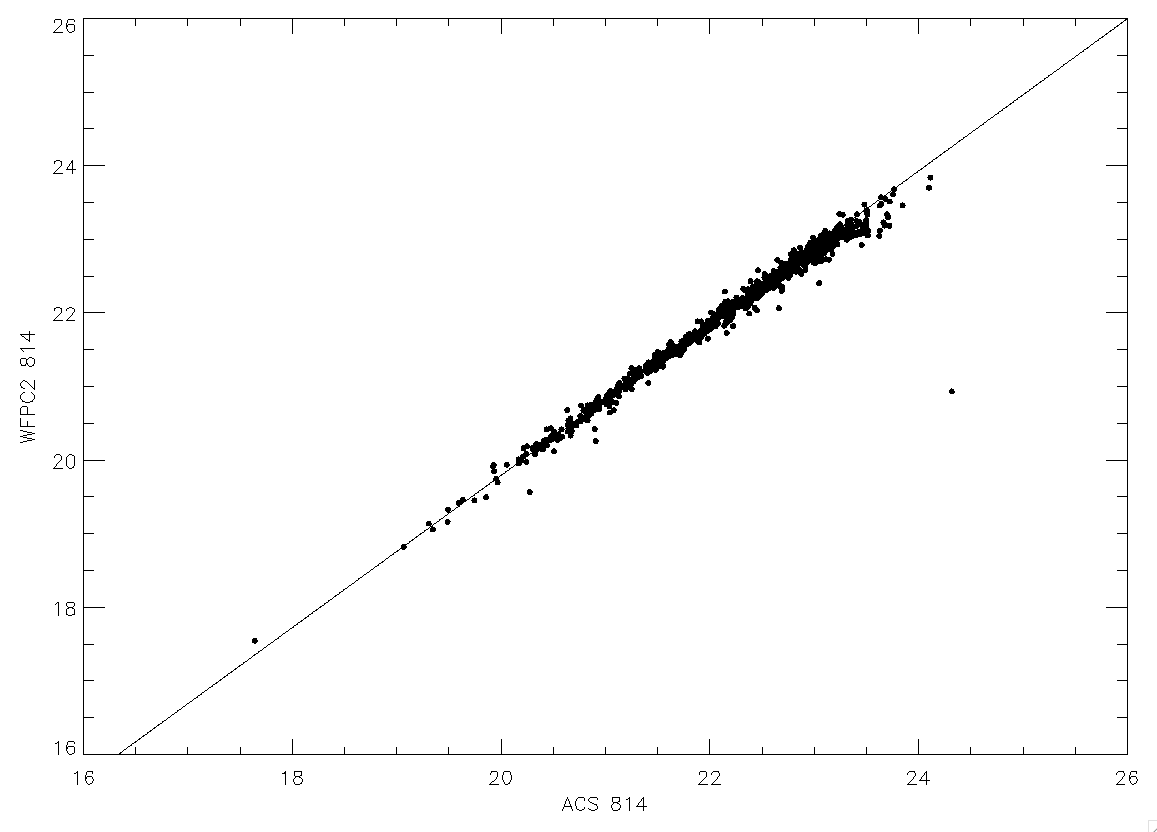
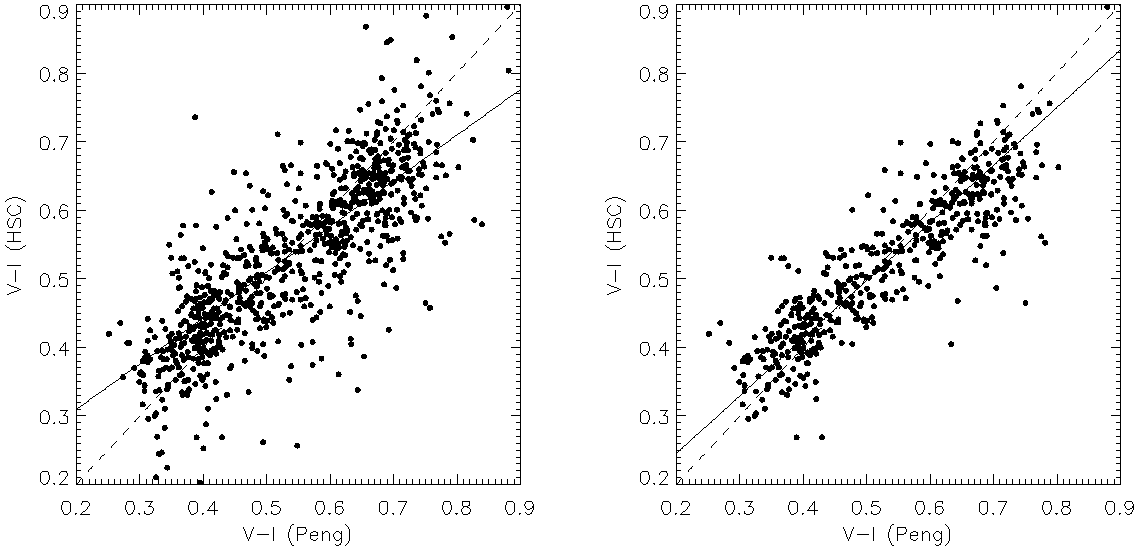
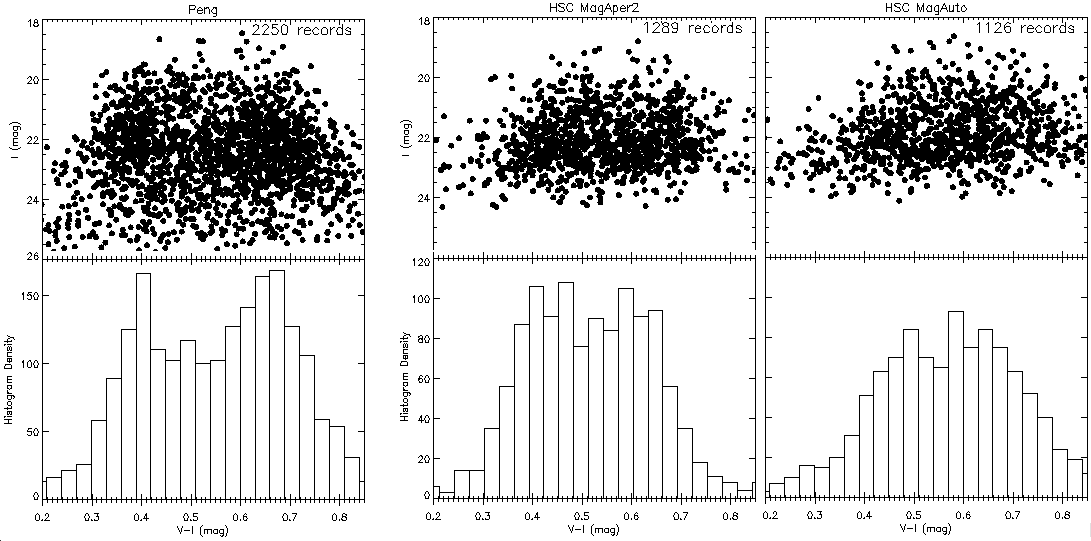
The MagAuto SExtractor values are an attempt to determine the total magnitudes of objects. Since we are primarily interested in determining the V-I color of the clusters it is probably more accurate to use aperture magnitudes hence the choice of MagAper2 (using a 3 pixel radius). Later in this exercise we compare results using MagAper2 and MagAuto.
The query should return 3065 results. The first source displayed is the nucleus, hence why there is a large number of images.
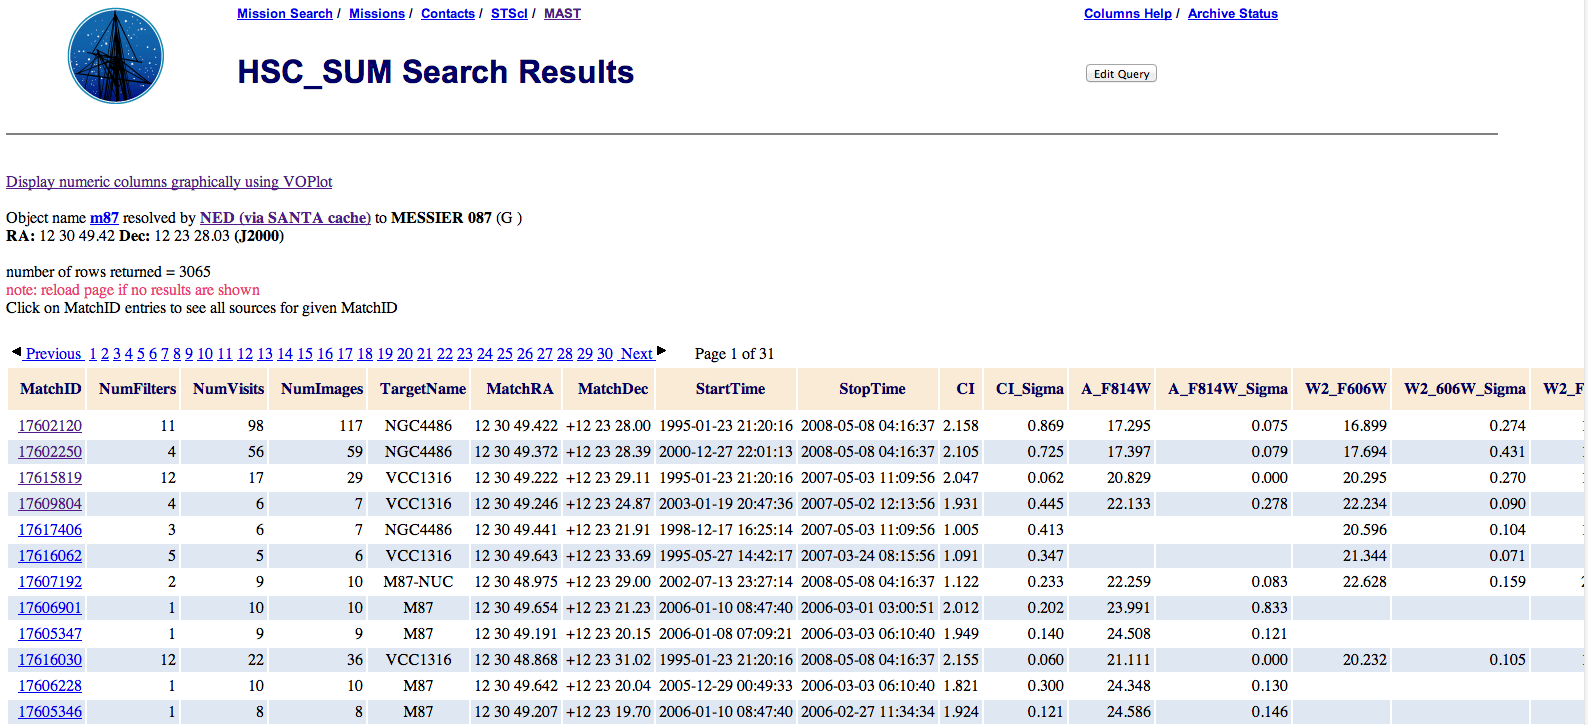
Click the matchID of the first source and it will take you to the DETAILED FORM where information for each individual image is displayed.
Note that in this example a large amount of the images were taken in experiment 10543. To view the abstract of this proposal, in the HLA reopen the inventory view for M87 and in the prop ID field filter the results to display only 10543. Follow the hyperlink on any of those 10543 proposal IDs.
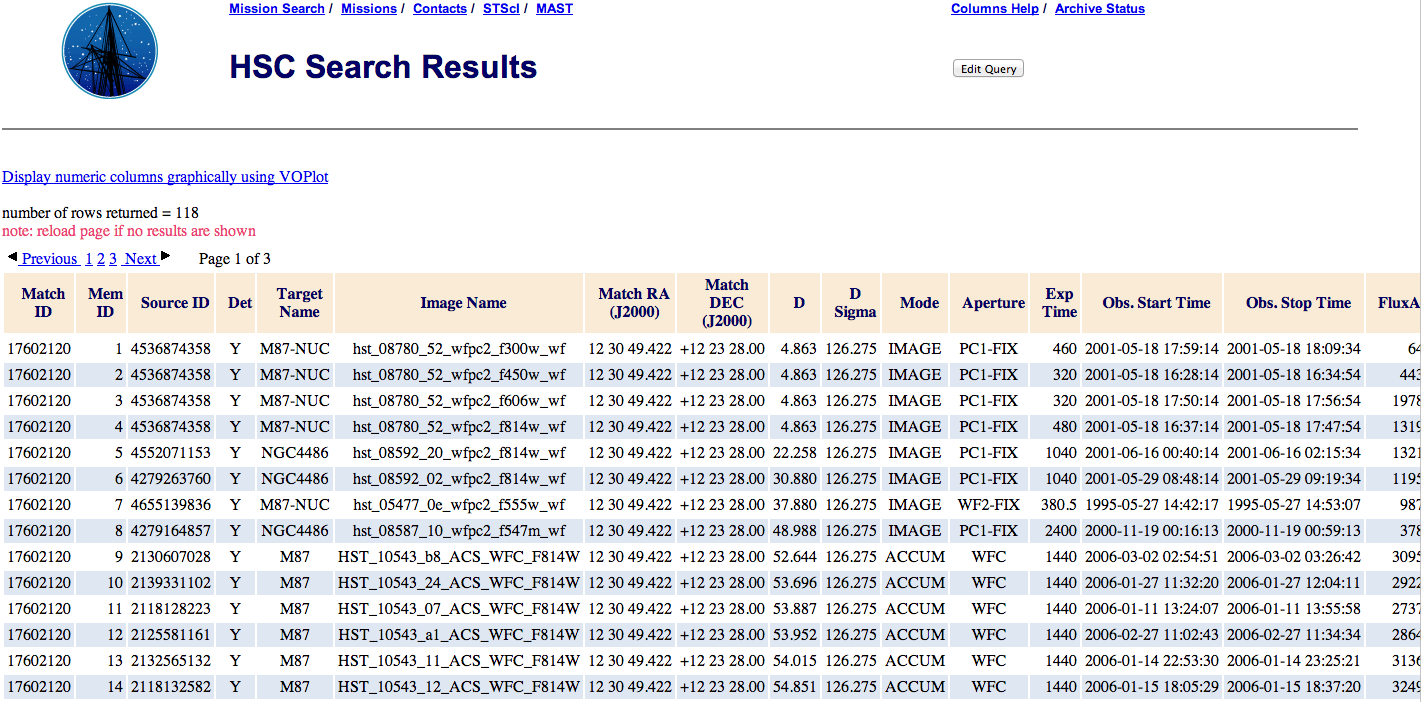
From analysis of this table it is clear that there is an abundance of ACS F814W (A_F814W) data but no ACS F606W (A_F606W). We will have to use WFPC2 F606W (W_F606W) data instead, unlike Peng et al. who exclusively used ACS. However the inventory view of the HLA shows 57 ACS F606W observations (to check this yourself simply search F606W in step 1 instead of F814W). The reason the A_F606W values are missing in the HSC is because a single image was taken in each visit. This makes it impossible to remove cosmic rays. However the A_F814W data used 4 exposures per visit, and so a high quality source list was made by the HLA. Which was used to determine the locations to measure photometry in the A_F606W image as well. The HSC software was not smart enough to know this and ignored the HLA A_F606W source list. This rule is being changed in the HSC and hence the A_606W data will be included in the next release.
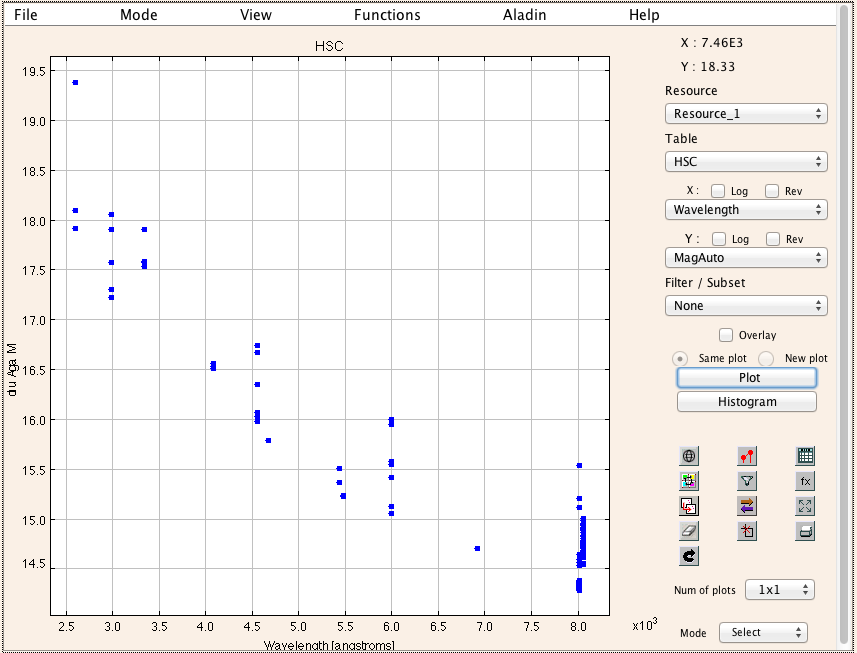
Click on "Display numeric columns graphically using VOPlot". It may take a while to load the data because of the large sample size. The display will say "No VOTable loaded" until the data appear. Set the x-axis to wavelength and the y-axis to MagAuto. We see several vertical lines of data for each of the filters. This gives us a feeling for what filters the data has been taken in. We find that a large number of observations have been taken in the F814W filter. We also note as above that the large numbers of A_F606W observations have not made it into the HSC.
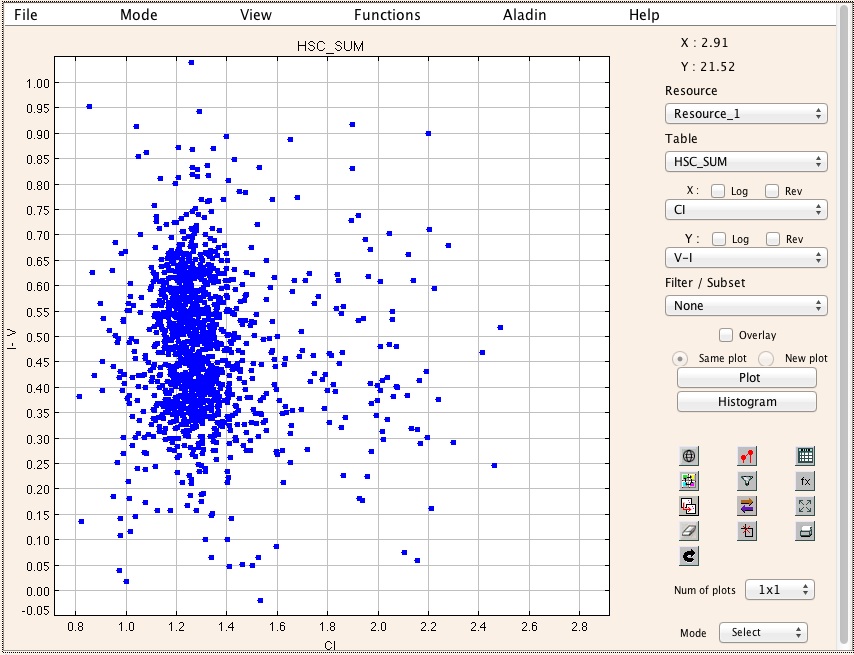
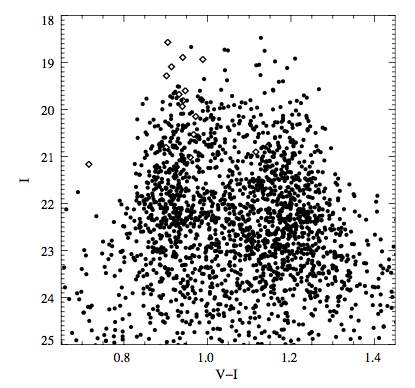
Now go back to SUMMARY FORM and use VOPlot to plot the color-magnitude diagram of M87. Open the functions tab in VOTable and select 'create new columns'. Since there is no A_F606W data we are forced to use magnitudes from WFPC2 which has less depth. Type $7 - $9 into the expression section. Enter a column name like 'V-I' and click add. Now plot V-I against W_F814W. To match the format of Peng et al. select the option to reverse the y-axis and change the limits with the 'format plot' button.
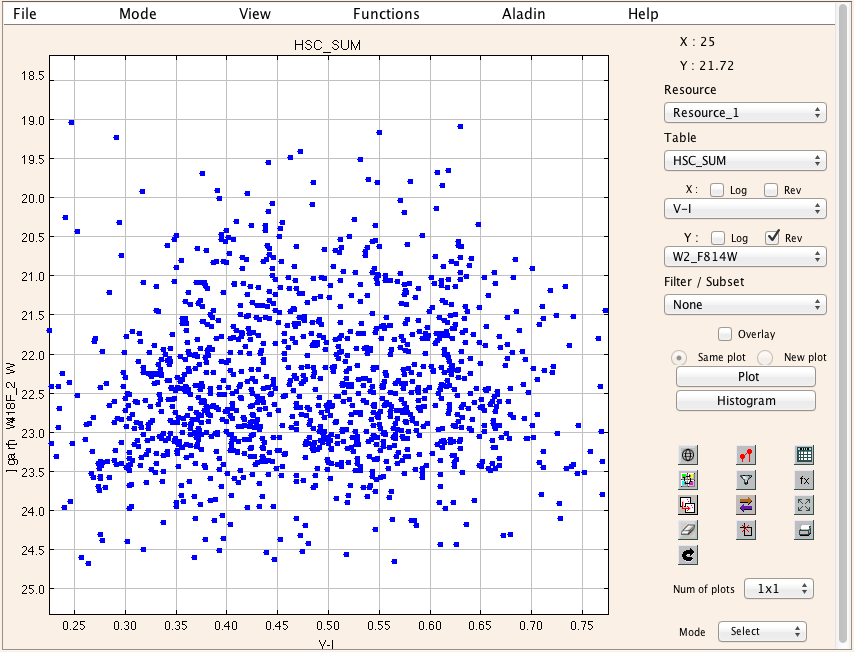
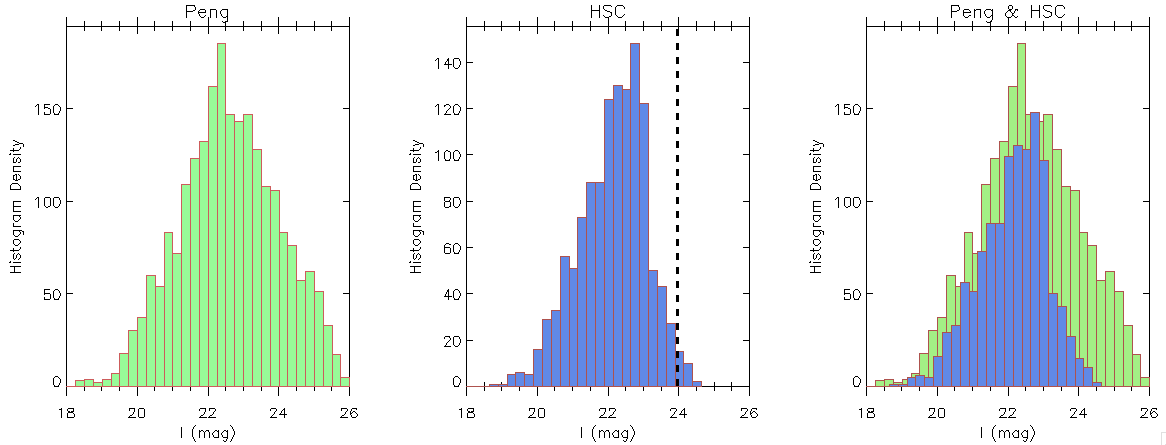
Note that this plot was constructed using only the HSC and the software contained within. While this is often sufficient, you may want to use your own favorite software package (e.g. IDL, IRAF, TOPCAT, ... ) to do more sophisticated analysis. We can see some of the key features in Peng et al. such as a bimodal distribution and a large red enhancement around I = 23 mag. This diagram has not been corrected for the different magnitude systems used by Peng at al. and the HSC, or corrected for extinction. This explains why the mean color for our diagram is V-I ≈ 0.5 (ABMAG), while for Peng et al. it is V-I ≈ 1.1 (VEGAmag system).
We will now show the steps to apply the necessary corrections and re-plot the graphs for a closer inspection.