
Mission Status Report #57 Star Date: April 26, 2002
FUSE Operations Continue NominallyHappily, the FUSE satellite continues to operate well after our recovery from Reaction Wheel problems, as noted in an earlier report. With each passing week, we are also learning more about our new control system and how it behaves both for slewing (moving between targets) and for static pointing stability. A quiet month for operations allows me do highlight some science results in this report. An important part of what astronomers do is to compare objects, looking for similarities and differences. We like to make atlases, where data from various classes of object can be directly compared, side-by-side. For FUSE scientists, this means comparing the SPECTRA of various objects. If we know something about a bunch of stars, let's say their spectral types from optical spectra (which is related to physical parameters of the stars, such as surface temperature or intrinsic brightness), the first thing we usually do is compare them in the FUSE range and try to understand what we see. For instance, in the figure below:
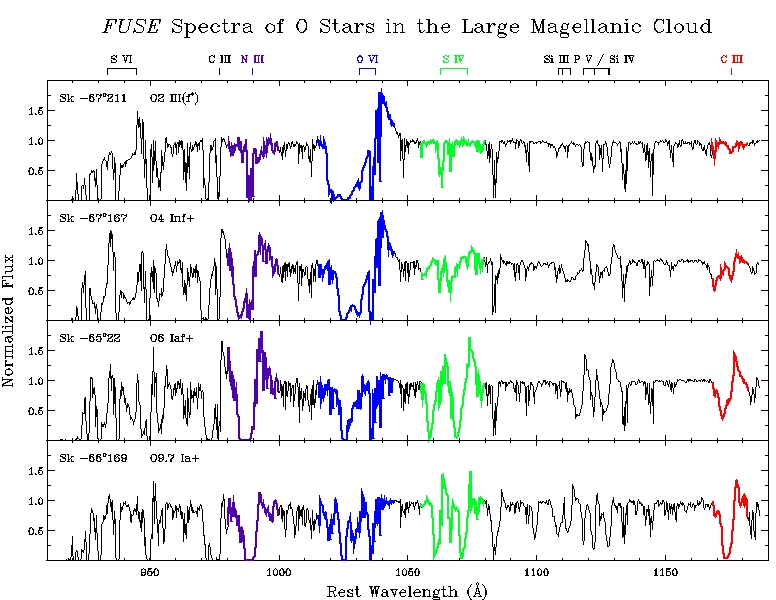
Caption: FUSE spectral data for several stars in the Large Magellanic Cloud, showing how various stellar wind features change systematically as a function of spectral type of the stars. (From an upcoming publication by Walborn, N. R., Fullerton, A. W., Crowther, P. A. et al. 2002, ApJS, 141, in press [August 2002].) (Click image above to see a larger version.) This figure shows the FUSE spectra of four so-called "supergiant" stars in the Large Magellanic Cloud, a nearby galaxy to the Milky Way. From top to bottom the spectral types change from O2 to O9.7 (which is to say from a surface temperature of about 45,000 K to about 28,000 K [81,000 to 50,000 Fahrenheit]). Compare the spectral regions highlighted in various colors in the four stars and you can see systematic changes. Some spectral features decrease in strength (blue region) and some get stronger (red region). In this example, the blue region is dominated by very hot gas (due to 5-times ionized oxygen atoms) and the red region is dominated by cooler gas (twice-ionized carbon atoms). The structure of these features tells astronomers that they are formed in the WINDS of these stars, and the changes tell us how the winds from these stars change with the temperature of the stars. There are many atlases of FUSE data in preparation at this time. Altases of hot stars in the Milky Way, hot stars in the Magellanic Clouds, cool stars in the Milky Way. Atlases that compare the interstellar absorption lines of molecular hydrogen or hot gas or cold atomic gas, in the disk and halo of the Milky Way or in the Magellanic Clouds, etc. By comparing data in this way, astronomers can find patterns that help them understand about basic physical properties occurring in the universe. And when we find a data set that doesn't match the pattern, that is usually what points us toward a new direction, requiring a new understanding or a more sophisticated model to understand the data. These atlases each contains hundreds of thousands to millions of seconds of FUSE exposure time on the included objects, and represent a huge investment of human effort. But this is an important way we learn about the universe around us. Reported by: Bill Blair, Chief of Observatory Operations
|