


 Follow Us
The Multimission Archive at STScI Newsletter
| April 15, 2005 | Space Telescope Science Institute | Volume 15 |
| The Multimission Archive at STScI (MAST) Newsletter disseminates information to users of the HST, FUSE, GALEX, IUE, Copernicus, EUVE, HUT, UIT, WUPPE, IMAPS, BEFS, TUES and VLA-FIRST data archives supported by MAST. Inquiries should be sent to archive@stsci.edu. |
| Index of Contents | |
|---|---|
| Archive Status |  |
| Pipeline MultiDrizzle Image Orientation | |
| High Level Science Products at MAST | |
| New Search Page for VLA FIRST Co-added Images | |
| New Web-based Tutorial Available | |
| MAST Tools | |
| The Virtual Observatory at MAST and STScI | |
| MAST Distributing the First Full Public Release of GALEX Data | |
| MAST User Survey | |
| Suggestion Box | |
| MAST User's Group Meeting | |
| Linking Archived Data with the Astronomical Literature | |
Archive Status
Total MAST Holdings are nearly 32 TB as of March 1, 2005.
The Digitized Sky Survey (DSS) remains one of the most popular datasets that MAST maintains. An average of nearly 150,000 searches are made of the DSS each month.
The default orientation for pipeline MultiDrizzle ACS images ("*_drz.fits")
has been changed to the unrotated image frame, instead of having North toward the top.
This leads to smaller images which are easier to transfer and display,
and can still be readily oriented North-up within most
image display programs such as "ds9". More importantly, images delivered in the
unrotated frame allow for instrument-specific effects to be much more easily
identified and accounted for, including bad columns, stellar diffraction spikes,
CTE trails, and PSF effects, and are also more useful for polarimetric,
coronagraphic and grism data. The ACS CTE correction formulae can also be more
readily applied to unrotated images. If images with North up are still required,
these can be generated by appropriately setting the "final_rot" parameter
when running MultiDrizzle off-line on the calibrated FLT files delivered from the pipeline.
The default orientation change was implemented March 25, 2005 at 12:50 PM EST.
High-Level Science Products (HLSP) are "value added" data products
contributed by our users. They include processed images and spectra,
object catalogs, and spectral and image atlases. Our collection of
HLSP has grown considerably over the past year. In order to make it
easier to find a specific HLSP, or to search for HLSPs that might be
useful for a particular scientific question, we have created a new
HLSP search interface that allows users to search by wavelength, type
of product, and object type. The search page is accessed from
http://archive.stsci.edu/hlsp/index.html.
MAST welcomes the contribution of scientifically useful HLSP based on
our missions. Updated guidelines for contributing HLSP may be found at
http://archive.stsci.edu/hlsp/hlsp_guidelines.html
New HLSP that we have added in the past year include:
The deepest existing optical image
of the sky, taken with the Advanced Camera for Surveys and
NICMOS. Reduced images and object catalogs are available.
archive.stsci.edu/prepds/udf/udf_hlsp.html
Version 2 of the NICMOS treasury data was archived in April 2005.
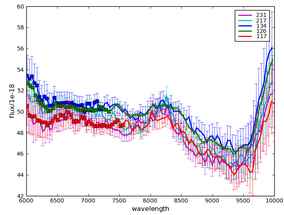
Adjacent is a thumbnail of the spectra for NGC 1068 Cloud B from this atlas.
Click on the thumbnail for a larger preview.
archive.stsci.edu/prepds/fos_agn/index.html
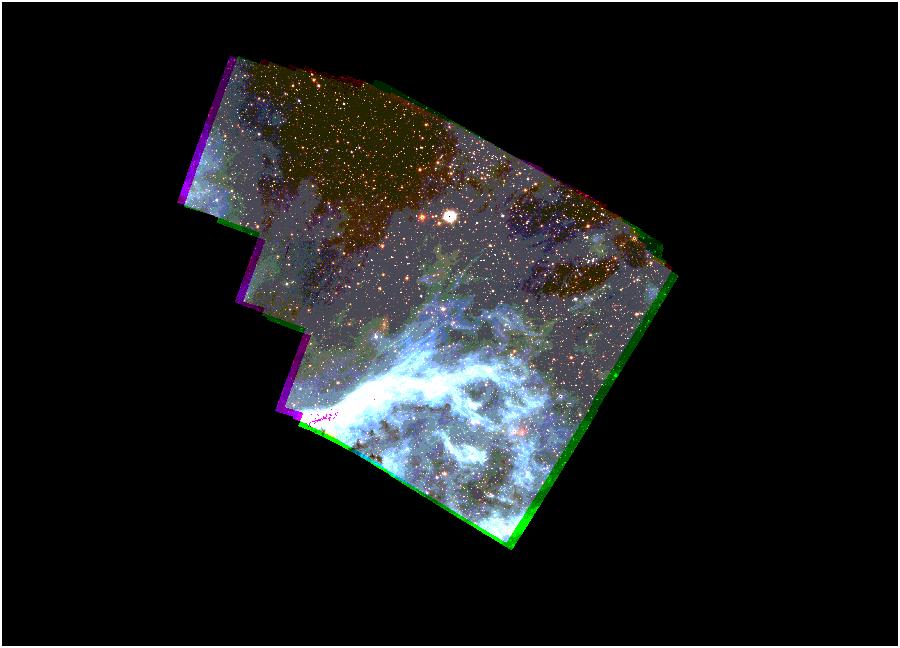
This is a thumbnail of the preview for a part of the LMC at RA=84.5275 Dec=-69.0214.
The product name is pu5hny501. Click on the thumbnail to see a larger preview.
To the right is a thumbnail of the preview of the data for Beta Aqr. Click on the thumbnail to see the full-size preview.
To the left is a thumbnail of the calibrated spectrum for object number 3822 in the UDF catalog.
Click on the thumbnail to see a full size preview image.
Many of our users just visit MAST to download their data. However,
MAST provides many sophisticated tools to search for, browse, and
cross-correlate data. If you have a specific task that you don't know
how to accomplish, or would just like to learn more about the
capabilities of the MAST interface, visit our new web-based tutorial
at http://archive.stsci.edu/tutorial/index.html. You will find a
general overview of how to navigate the newly reorganized MAST
website, a guide to the various interfaces, a summary of MAST Tools,
hints for searching for and retrieving data, and a guide to further
documentation.
We are constantly improving our existing tools and adding new
ones. Here are some highlights from the past year:
(http://archive.stsci.edu/mast_coplot.html) now has the option of
displaying the average of "like" spectra.
Two buttons have been added to plot just the average of like spectra or to coplot this average along
with the constituent spectra. In both cases the mean spectrum is labeled "Average spectrum" and plotted in black.
The averaging option works only for "like" spectra.
The averaging option keys on the total number of points represented in the first (primary) spectrum
(irrespective of the wavelength limits entered). The averaging option of the Coplotter is a "dumb"
feature, meaning that it can be used only to compute averages from spectral files having the same
number of total points, i.e. spectra observed in a common instrumental configuration. For example,
an LWP or LWR IUE spectrum will not be properly coaveraged with an IUE SWP spectrum (or a HST/GHRS spectrum
with another GHRS spectrum observed with a different grating). If a secondary spectrum is added
which fails this equality-of-points test, the secondary will be overplotted but not coaveraged.
Garbage in, garbage out!
In the example to the right, three SWP low dispersion spectra of Capella and their average are shown.
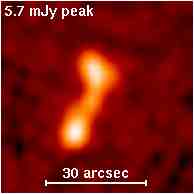
The plot to the right is the FUSE plot of the star HD 120991 (observation Q1140101000) that is the current "representative" FUSE observation for this target.
Links to 2MASS images are now included in the MAST scrapbook (using data type = images).
The 2MASS data (available as both jpg images and FITS files) are 20'x20' and are centered
on the listed MAST observations.
The VizieR search form now offers the ability to search on
ADC-defined astronomical terms as well as keyword searches on author's
name, catalog title, and catalog description. This allows searching on
many object classes.
A new version of VOPlot is now accessible from the MAST search
results pages. VOPlot is a tool for visualizing astronomical data,
designed to work with data in the Virtual Observatory compatible
VOTable format. For more information see
http://vo.iucaa.ernet.in/~voi/voplot.htm
SpecView, a sophisticated Java application for 1-D spectral visualization and
analysis of astronomical spectrograms, is now available. SpecView is
capable of reading all the HST spectral data formats, as well as data
from a few other instruments (such as IUE, FUSE, ISO, FORS and SDSS),
MAST spectral previews, and data from generic FITS and ASCII
tables. It can also read and write spectrogram data in Virtual
Observatory SED format.
SpecView was developed by Ivo Busko of the Science Software Branch at STScI with
input from MAST archive scientists. To download the application and for more information see the web page:
http://www.stsci.edu/resources/software_hardware/specview
StarView was upgraded to version 7.3 in July of 2004. Version 7.3
features protocol to aid users behind strict firewalls, improved
database connectivity, and many improvements that enhance performance,
reliability, and usability. Please visit
http://starview.stsci.edu/html to download or learn more about
StarView.
Visit our web page at http://archive.stsci.edu/vo to read about how
MAST is participating in the National/International Virtual
Observatory. This page also provides useful VO-related links. Check
this site for updates about our ongoing activities. A more general
site devoted to VO activities at STScI is http://nvo.stsci.edu.
Some examples of recent VO-related developments at MAST are:
STScI staff continue to be active in National Virtual Observatory
development activities. In September 2004 we led the organization of
the first NVO Applications Software Development Summer School, in
which 40 graduate students, post-docs, and software developers spent a
week learning about NVO tools and technology at the Aspen Center for
Physics. We also held a special session on
NVO-enabled research at the January 2005 AAS meeting
in San Diego. Several talks featured results from student projects at
the Summer School. The San Diego AAS meeting was also the venue for
the NVO project's first substantial public software release (details
at http://us-vo.org). NVO developments were featured in many of the
talks and posters at this year's ADASS Conference (October, Pasadena),
including new VO-compatible features of MAST. International VO
collaboration centered around the "interoperability" meeting held in
Pune, India, in September 2004.
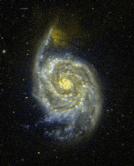
MAST began distributing data products from the GALEX (Galaxy
Evolution Explorer) satellite in November, 2004. This
distribution continued with four sub-releases that through
December, 2004. The first subrelease, called "GR1a," consisted of
image products for the Medium Imaging Survey (MIS) and Nearby Galaxy
Survey (NGS). Subsequent subreleases GR1b-d included image products
from the All-sky Imaging Survey (AIS; GR1b) and Deep Imaging Survey
(GR1c). Release GR1d consisted of spectroscopic products for the
Medium and Wide Spectroscopic Surveys (MSS, WSS). Users can access
GALEX data from the MAST website at http://galex.stsci.edu. Click on
"Search" on the left menu to initiate a search using either a
"MAST-style" search form or a customized SQL-based search form. You
can download data file by file via your browser or for an entire
dataset via ftp.
Recently the GALEX team implemented CASJobs Batch Query Services
which allows enhanced and personalized SQL access to the GALEX databases.
If you register, you receive local storage on the server, where you may create tables using the "select into" statement.
This storage is called MYDB.
Tables that you create in MYDB may be extracted to FITS, VOTABLE, or CSV using the extract page.
You control your MYDB, and you may drop tables in it to make more space.
MYDB is a proper database and you may join tables in MYDB with tables in any GALEX target database.
There is a users guide.
Other documentation is linked from the main CASJobs page.
CASJobs is made possible by the Sloan Digital Sky Survey Collaboration.
MAST conducted a User Survey in January, 2005, to gather information
that helps us support our users' needs and to prioritize our plans for
improving and expanding archive services at MAST. We thank all the
users who took the time to respond to the survey. We received
responses from 288 users. Of those who responded to the question,
251 were non-STScI employees and 32 were STScI employees.
You can browse the results of the survey at
http://archive.stsci.edu/surveyresults/survey_jan2005.html.
We have also prepared a response to some of the comments we received, which
may be of general interest to many of our users. This response is at
http://archive.stsci.edu/surveyresults/response2005.html.
While you may post any comments anonymously, often it would be extremely useful to ask you
for further clarification or feedback on implementation in response to a suggestion so providing
your email address is an option.
We anticipate that the responses to some suggestions or comments will be of interest
to the wider archive user community, while we understand that some queries may divulge
science goals that users would prefer not to make public. So, therefore
we ask you to tell us if we can post your comment and our response on the web.
All postings on such a website will be anonymous even if you have identified yourself.
MAST held the annual meeting of our Users' Group on February 17,
2005. The MUG members in 2005 were Ann Zabludoff (Chair), Tom Ayres,
Anton Koekemoer, Jeff Newman, James Herald, and Aki Roberge. The MUG
provides us with important feedback from the user's perspective, helps
to set priorities and suggests directions for future enhancements to
the archive. You can read the MUG's report from this year and previous
years at http://archive.stsci.edu/mug/.
MAST is a member of the Astrophysics Data Centers Executive Council
(ADEC; http://www.adccc.org/),
which coordinates activities between
NASA's data centers (ADS, HEASARC, IRSA, LAMBDA, MAST, NED,
NSSDC/ADF/ADC) and largest active mission operations centers (CXC,
GLAST, Spitzer Science Center, STScI). The ADEC has recently developed
a recommended naming convention for referencing datasets in the
astronomical literature. As of January 2005, the publications managed
by the AAS provide authors with a mechanism that allows them to make
links between their articles and the observational data that is
presented in them using these "dataset identifiers". The dataset id's
are specified as keywords in the AASTeX manuscript. Eventually, these
keywords will be required by the journals.
For more information on the naming conventions, see
http://archive.stsci.edu/pub_dsn.html. To verify the existence of
particular MAST data sets using the standard naming conventions, and
display the recommended data set reference following the AAS
guidelines, go to http://archive.stsci.edu/dataset_verifier.php. More
information on the proposed dataset identifiers and how to specify
them in an AASTeX manuscript can be found at Chandra web site at:
http://cxc.harvard.edu/cda/datasetid.html.
If you would like remove yourself from the mailing list send mail to
archive_news-request@stsci.edu
and put the single word unsubscribe in
the BODY of the message. Information on the subject line will be
ignored.
If you would like to subscribe to the mailing list to receive notification of future Archive Newsletters, send mail to
archive_news-request@stsci.edu and put the single word
subscribe in the BODY of the message. Information on the subject
line will be ignored. You will be asked to confirm the
subscription.
|

 While the HST archive dominates the archive in terms of data archived and retrieved, other datasets are utilized.
MAST began archiving and distributing GALEX data products in November 2004.
MAST now holds around 8.25 GB of GALEX image data.
Since distribution of GALEX data began in November, 2004, MAST has distributed over 400GB of GALEX data.
As subsequent deliveries are made, we expect the GALEX archive to grow to around 7 TB.
While the HST archive dominates the archive in terms of data archived and retrieved, other datasets are utilized.
MAST began archiving and distributing GALEX data products in November 2004.
MAST now holds around 8.25 GB of GALEX image data.
Since distribution of GALEX data began in November, 2004, MAST has distributed over 400GB of GALEX data.
As subsequent deliveries are made, we expect the GALEX archive to grow to around 7 TB.
 Hubble Ultra-Deep Field (HUDF):

 Several hundred new coadded VLA FIRST images were added or
replaced in the past year and there are now over 29,000 files included in this on-line archive.
The data have all been placed in the anonymous ftp area on archive.stsci.edu.
To make retrieval of these data easier, MAST has added a new
search page for the VLA FIRST co-added data at
Several hundred new coadded VLA FIRST images were added or
replaced in the past year and there are now over 29,000 files included in this on-line archive.
The data have all been placed in the anonymous ftp area on archive.stsci.edu.
To make retrieval of these data easier, MAST has added a new
search page for the VLA FIRST co-added data at
 FUSE spectra are now included in the spectral part of the MAST Scrapbook
(
FUSE spectra are now included in the spectral part of the MAST Scrapbook
(
 We find that the responses that our users give us as part of the survey are often the most
interesting and useful aspect of the responses. We administer a survey once a year or so,
but value responses and suggestions all year. We have implemented a "suggestion box" at
We find that the responses that our users give us as part of the survey are often the most
interesting and useful aspect of the responses. We administer a survey once a year or so,
but value responses and suggestions all year. We have implemented a "suggestion box" at
|
|
|