
Step 1 - Enter the HST CasJobs webpage http://mastweb.stsci.edu/hcasjobs/ and create an account using the button in the top menu bar (blue). Go ahead and login (green). |
 |
|
Step 2 - Inspect the HSC databases and functions. Click MyDB in the top menu bar (blue). This displays all the tables and functions you create in "MyDB" (My Database). Now change the "context" (the database used to run your query) from MyDB to HSC (green), using the dropdown menu on the top left. This shows the available views, tables, functions and procedures related to the HSC database. For example, click Tables (green) , and then select SumMagAper2Cat (i.e., the HSC Summary Form using magaper2 magnitudes) (orange). Scroll across to see the fields located in this table, such as Match ID (yellow), the instrument and filter used (i.e., W2_F122M is the magaper2 magnitude using the Wide Field Planetary Camera 2 image and the F122M filter) (yellow). A description of the table and some of the columns are provided. You might want to examine the Function SearchSumCatalog also, since you will be using it in a minute. |

Now click Query. Change the context from MyDB to HSC (if necessary) (blue). Copy and paste the text from above into the blank query text box (green). Click Quick (orange) to submit the job. Since this is a Quick submission, the table is not saved to MyDB, but is instead listed below. If you want to save the table, add "INTO M87_V2" to the end of the query (see Step 8). The table can also be downloaded to a local file using the Save As botton (yellow) at the bottom of the page. Another option is the Submit button, which is generally used for longer queries. The table is saved using the name in the box under "Table(optional)", which defaults to MyTable; change this to M87_V2 for our example. Try this. It takes about a minute. To see the table click the MyDB tab, click on M87_V2, and click on Sample to see the file.  |
 |
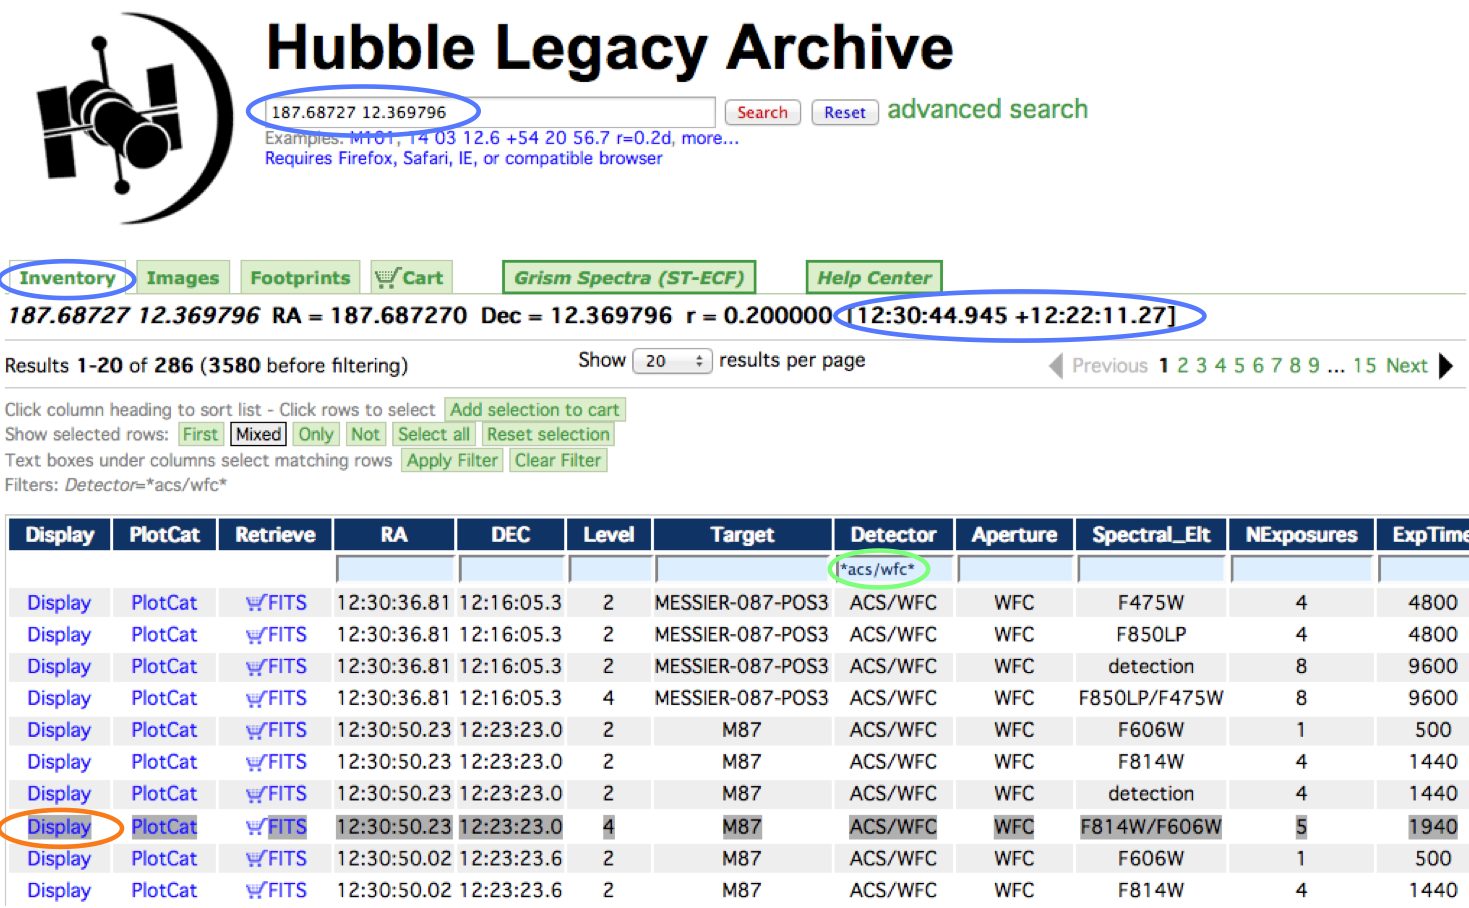
Step 4 - Examine an image. It is a good idea to look at the HSC overlayed on an image, to check for artifacts and uniformity. Copy the MatchRA and MatchDec values of the first source from your table. Open the HLA and paste those values into the search box (blue). Click Search. Note: The HLA displays your search coordinates in both decimal degrees and sexidecimal format (blue). This is useful if you want to find a specific object in the Interactive Display. In the Detector field enter *acs/wfc* (green) to select just the ACS Wide Field Camera images. Click on the Display (orange) button for the F814W/F606W (color) image (or click on the Images button if you would like to look at previews of all the images). |
Step 5 - Determine the value of NumImages to use.
Click advanced HSC controls, Require NumImages > 10, and then the HSC (blue) button to overlay the HSC on this particular image. We find that NumImages > 10 leaves
a number of artifacts in a star-like ring around the inner region. If you click on a few of the real objects (green) you find they all have more than NumImages = 50. Some have over 120 ! Go back and change to Require NumImages > 50 (orange) to remove essentially all of the artifacts (although you are still missing some objects near the center of the galaxy). DETERMINING THE BEST VALUE OF NUMIMAGES IS OFTEN ONE OF THE MOST IMPORTANT DECISIONS YOU WILL HAVE WHEN USING THE HSC !  |
 |
Step 6 -
You can also use the MAST Discovery Portal to make the same
query, since this is a relatively small dataset. Several other HSC Use Cases (e.g., # 1: Using the Discovery Portal to Query the HSC - Stellar Photometry in M31; Brown et al. 2009)
provide more detail. The
Discovery Portal can be used to make plots (like in
Step 7) and to reach the HLA Interactive Display (like in
Step 5).
In this example we center on the coordinates of the first object (blue) in the list from the CasJobs search in Step 3 to find the object with matchID = 250841 (orange). Also note that M87 has been visited 116 times using 172 different images (green) ! |
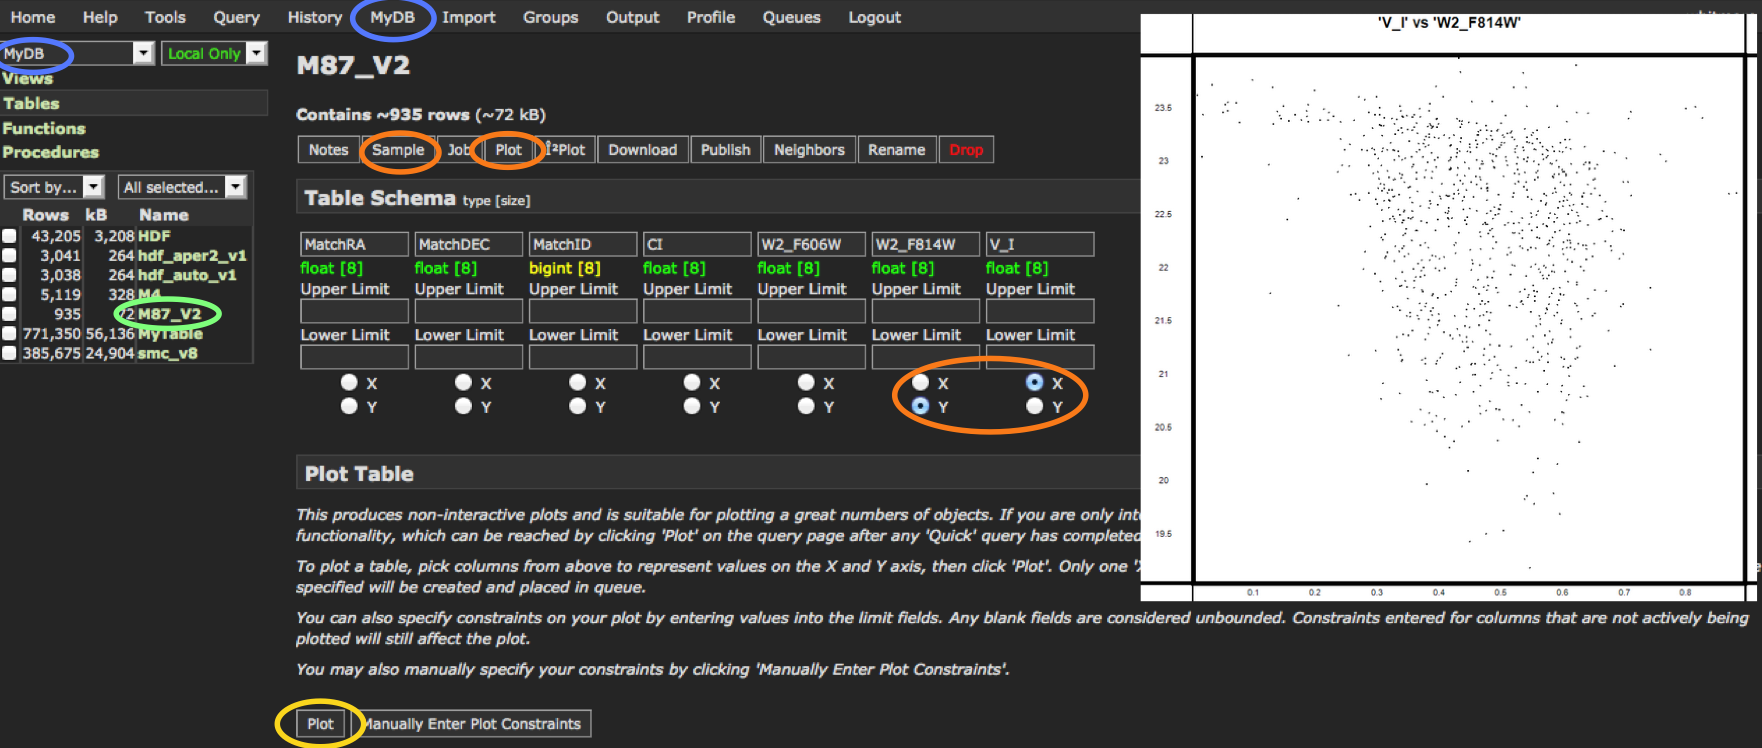
Step 7 - Make a plot using CasJobs. Click on MyDB (blue) in two places, then find the table M87_V2 (made in Step 3) and click on that (green). You can then click on Sample (orange) to see the data, and Plot (orange) to make a plot. Designate the X and Y columns (orange) on the right and click Plot at the bottom (yellow).
You will be directed to the output tab in the menu bar, where you will see the plot is pending. The queue gets refreshed every 30 seconds; you can hit the refresh icon in your browser to check more frequently. Click Download when it is ready to see the plot on the right. |  |
