 Step 1 -
Enter the Hubble Legacy Archive (HLA - type hla.stsci.edu in your
browser window). Click Enter Site here.
Step 1 -
Enter the Hubble Legacy Archive (HLA - type hla.stsci.edu in your
browser window). Click Enter Site here.
Goal - This walkthrough will demonstrate how to search for variable objects using the Hubble Source Catalog. We will use the WFPC2 F814W observations of the known variable V4334 Sgr.
Step 1 -
Enter the Hubble Legacy Archive (HLA - type hla.stsci.edu in your
browser window). Click Enter Site here.
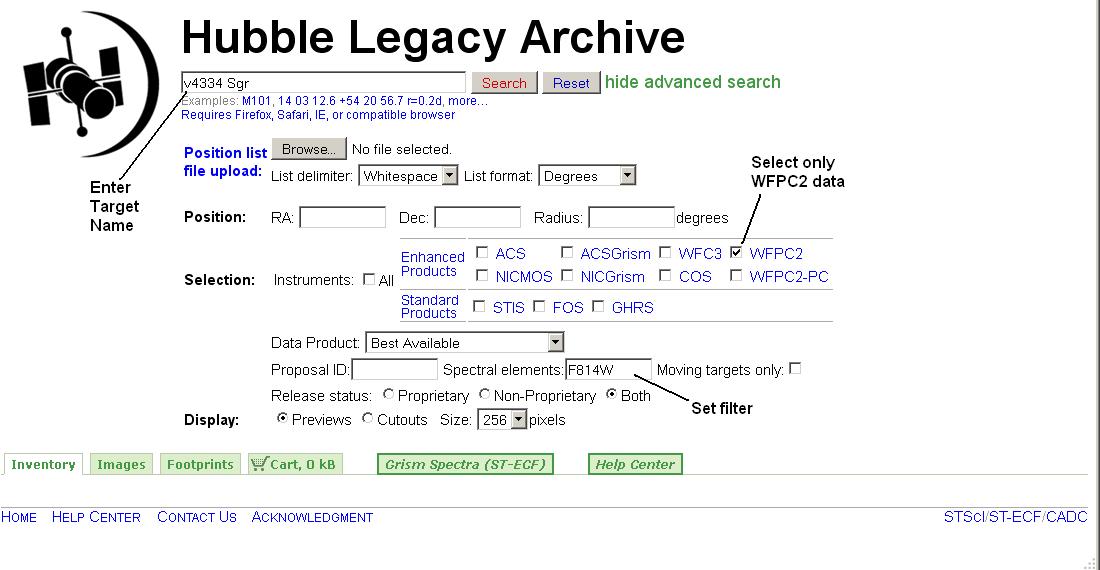 Step 2 -
Click advanced search. Enter V4334 Sgr as the Target,
select WFPC2 data only, enter F814W in the Spectral Elements box, and click.
This puts you in the Inventory view.
Step 2 -
Click advanced search. Enter V4334 Sgr as the Target,
select WFPC2 data only, enter F814W in the Spectral Elements box, and click.
This puts you in the Inventory view.
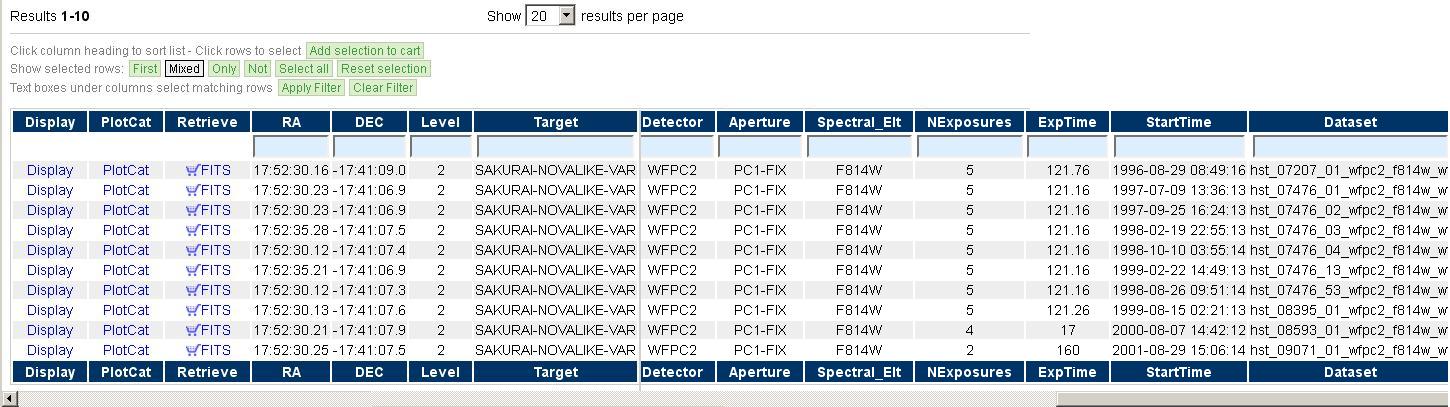
Step 3 -
There are 10 images of the field, spanning a 5 year period from 1996
to 2001.
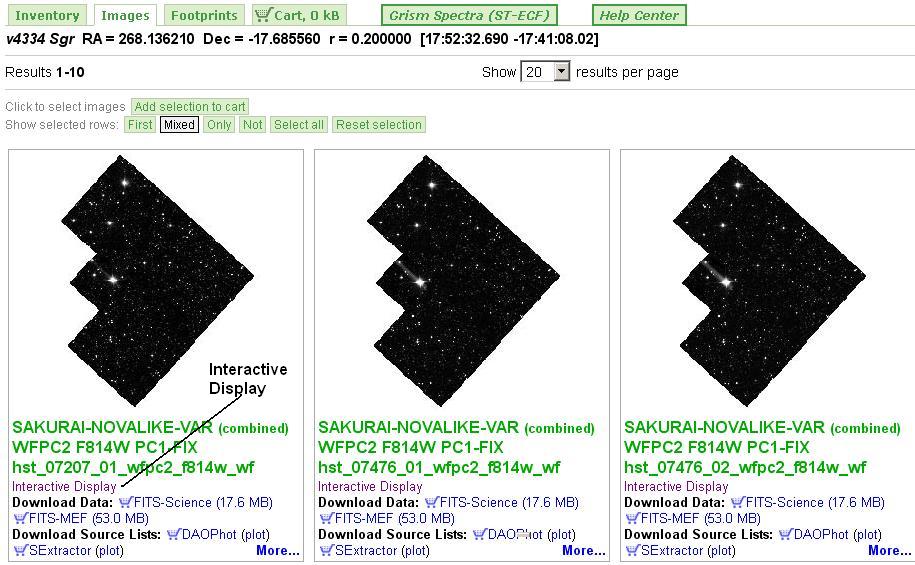 Step 4 -
Click the Images button to see the data, and
click on Interactive Display for the first image.
Step 4 -
Click the Images button to see the data, and
click on Interactive Display for the first image.
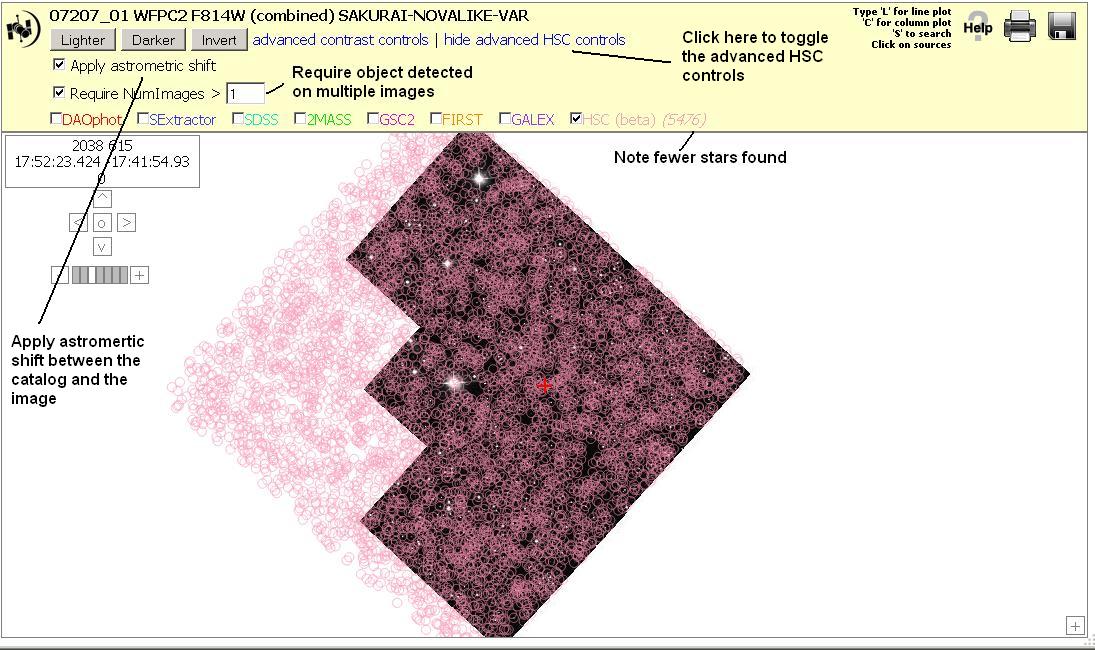 Step 5 -
Click the advanced HSC controls. The astrometric calibration for any
one image may be different than that of
the catalog itself (which was generated from a combination of
images); see "FIVE THINGS YOU SHOULD KNOW ABOUT THE HSC".
You should select the
Apply Astrometric Shift to align this particular image with the catalog; note
that this offset may be large (>5") in some instances (for example,
image hst_7476_03_wfpc2_f814w_wf).
Click on the pink HSC (beta) box to see the HSC sources.
Click on Require NumImages>1 to eliminate objects only detected on a single
image (generally artifacts). Note that the number of objects has been
reduced from 7886 to 5476.
Step 5 -
Click the advanced HSC controls. The astrometric calibration for any
one image may be different than that of
the catalog itself (which was generated from a combination of
images); see "FIVE THINGS YOU SHOULD KNOW ABOUT THE HSC".
You should select the
Apply Astrometric Shift to align this particular image with the catalog; note
that this offset may be large (>5") in some instances (for example,
image hst_7476_03_wfpc2_f814w_wf).
Click on the pink HSC (beta) box to see the HSC sources.
Click on Require NumImages>1 to eliminate objects only detected on a single
image (generally artifacts). Note that the number of objects has been
reduced from 7886 to 5476.
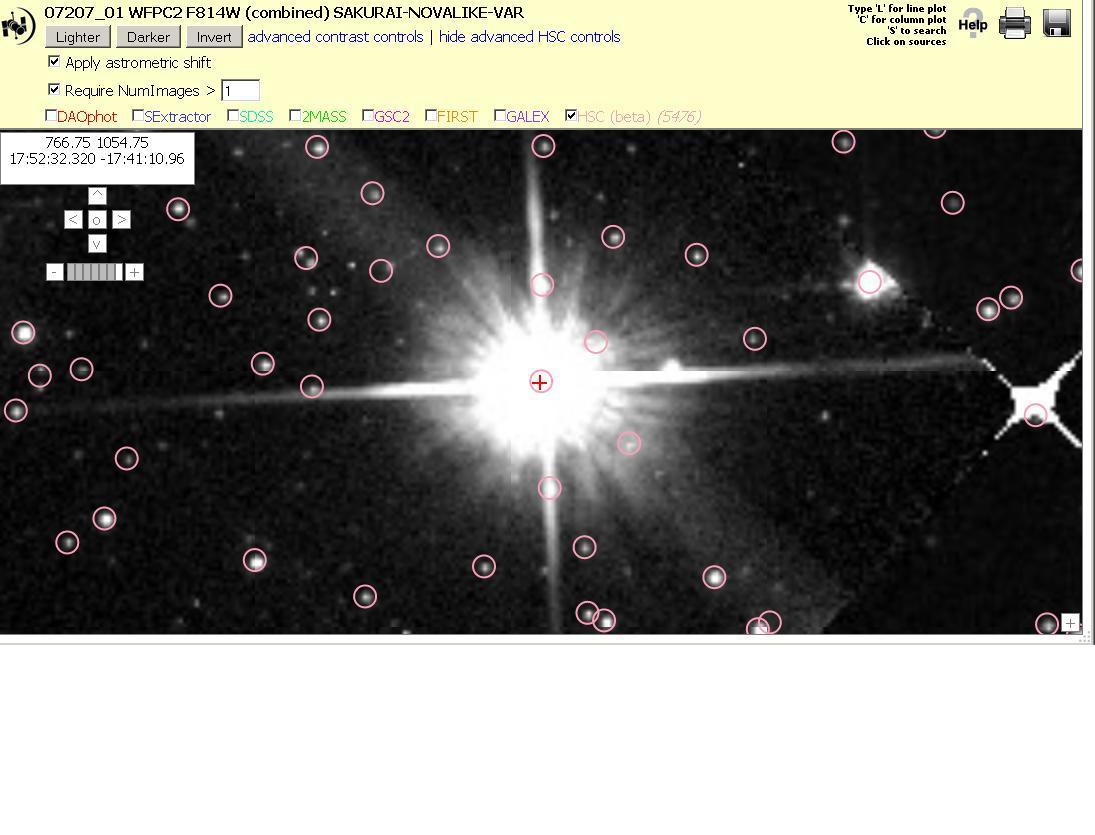
 Step 6 -
Zoom-in on the field shown on the right (right part of the PC chip
at X = 710, Y = 1085) and pick the bright star near the middle of the
image. Click on the Pink circles to see the HSC information.
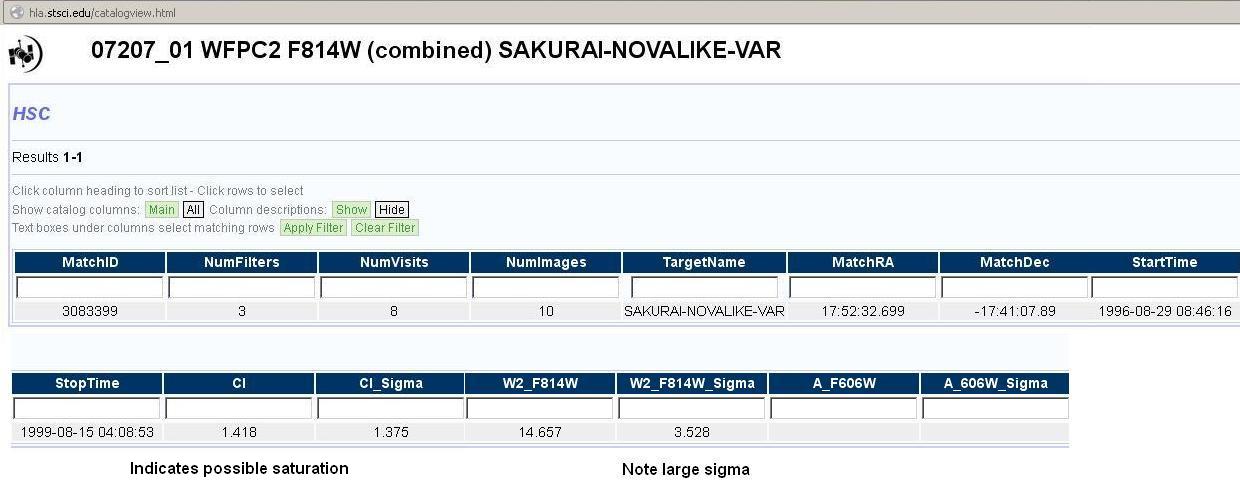
The HSC includes data from
10 images for this star. Scroll over to see the HSC information. For
example, for MatchID = 3083399 the mean magnitude in W2_F814W is 14.657,
the scatter in all the measurements is sigma = 3.528 mag, which
indicates this is a candidate variable (in fact, this is V4334 Sgr
and was the prime science target for this observation). Also note
that the
concentration index is CI = 1.418 (Note: This is large for a star -
probably because the star is saturated in some of the images, which
will affect the accuracy of the photometry).
Step 6 -
Zoom-in on the field shown on the right (right part of the PC chip
at X = 710, Y = 1085) and pick the bright star near the middle of the
image. Click on the Pink circles to see the HSC information.
The HSC includes data from
10 images for this star. Scroll over to see the HSC information. For
example, for MatchID = 3083399 the mean magnitude in W2_F814W is 14.657,
the scatter in all the measurements is sigma = 3.528 mag, which
indicates this is a candidate variable (in fact, this is V4334 Sgr
and was the prime science target for this observation). Also note
that the
concentration index is CI = 1.418 (Note: This is large for a star -
probably because the star is saturated in some of the images, which
will affect the accuracy of the photometry).
 Step 7 -
Go to the HSC Home page
(or you can also get there by going to the "What's New in DR7.1" back on the
HLA homepage, then clicking Hubble Source Catalog (HSC).)
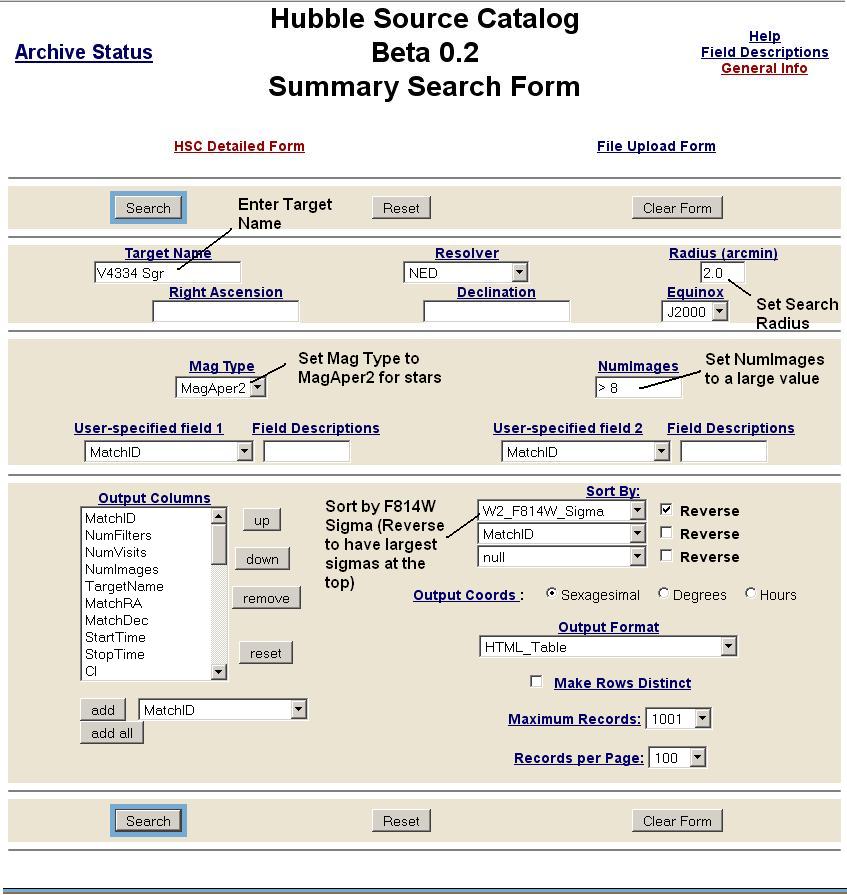
Click on Search with Summary Form. Enter the coordinates from above in
the Right Ascension and Declination boxes (or in this case, input the
Target Name), set a large search radius to
get a large field, set NumImages=8 (to try and eliminate objects with
only 2 magnitudes in our filter), change the Mag Type to MagAper2 (which
is appropriate for stars), and click Search. Note that you can also
change the Sort parameters so that objects with the largest sigmas
(i.e. the most likely variables) are at the top.
Step 7 -
Go to the HSC Home page
(or you can also get there by going to the "What's New in DR7.1" back on the
HLA homepage, then clicking Hubble Source Catalog (HSC).)
Click on Search with Summary Form. Enter the coordinates from above in
the Right Ascension and Declination boxes (or in this case, input the
Target Name), set a large search radius to
get a large field, set NumImages=8 (to try and eliminate objects with
only 2 magnitudes in our filter), change the Mag Type to MagAper2 (which
is appropriate for stars), and click Search. Note that you can also
change the Sort parameters so that objects with the largest sigmas
(i.e. the most likely variables) are at the top.
 Step 8 -
The first
object should have MatchID = 3083399, with much of the same
information as shown in step 6 (although we now have MagAper2 instead
of MagAuto). Note that there are a large number of stars for our variable
star search.
Step 8 -
The first
object should have MatchID = 3083399, with much of the same
information as shown in step 6 (although we now have MagAper2 instead
of MagAuto). Note that there are a large number of stars for our variable
star search.
To get a detailed listing of all the magnitudes for a particular star,
click on the MatchID. For 3083399, you will see the magnitudes range from
12.587 to 19.702 (with the object not detected on 4 F814W images); note that
this listing contains the magnitudes in all filters in the HSC.
To get a detailed listing with only the filter of interest, go to the
HSC Detailed Search form and set User-specified field 1 to MatchID
(with a value of 3083399) and User-specified field 2 to Filter (with a
value of F814W).
Step 9 -
Go back to the HSC Summary Search Form to make a catalog to download.
Change the Output Format to write to a file (e.g. Excel Spreadsheet) and
the Maximum Records to 10001.
The following step could be done with the
VOPLOT tool accessed from the HSC, but since we use that approach
in STEP 2 of Use Case #1, we here show another option (excel)
that many people are probably familiar with.
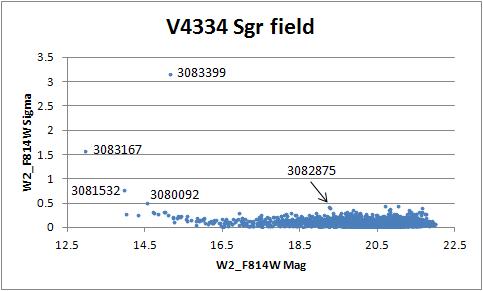 Step 10 -
To search for candidate variable stars, we will plot the magnitude
errors as a function of magnitude. Looking at the scatter in the
diagram, we will set our variability criteria to be a sigma
>0.35 mag. The candidate variables are labelled on the plot.
Candidates 3083167, 3081532, and 3080092 are all suspects
since they are extremely bright and saturation problems may be
responsible for the large values of sigma. 3082875 is a better candidate
since it is fainter and hence does not have saturating issues
Step 10 -
To search for candidate variable stars, we will plot the magnitude
errors as a function of magnitude. Looking at the scatter in the
diagram, we will set our variability criteria to be a sigma
>0.35 mag. The candidate variables are labelled on the plot.
Candidates 3083167, 3081532, and 3080092 are all suspects
since they are extremely bright and saturation problems may be
responsible for the large values of sigma. 3082875 is a better candidate
since it is fainter and hence does not have saturating issues
 Step 11 -
We now need to verify that the objects are real variables (e.g.
the large sigma is not due to image artifacts).
We need to get the detailed data for each of our candidates.
You can do this
by looking at the information on the Detailed Form or by getting the
coordinates for the candidate and looking at the images using the
Interactive Display (See Steps 4 and 5).
Step 11 -
We now need to verify that the objects are real variables (e.g.
the large sigma is not due to image artifacts).
We need to get the detailed data for each of our candidates.
You can do this
by looking at the information on the Detailed Form or by getting the
coordinates for the candidate and looking at the images using the
Interactive Display (See Steps 4 and 5).
You can then go to the HLA and make charts for each of the stars on
each of the images on which it is present. For candidate 3083399, we
see that variability is in fact real;
this is V4334 Sgr, a known variable. Note that the Concentration
Index (CI) is high for the first image, which indicates the star
was likely saturated at some level (and therefore the photometry is
not reliable).
For candidates 3083167, 3081532, and 3080092 you can see that the stars
look about the same brightness on all images. However, the Concentration
Indices in the F814W filter vary wildely. For example, the CI for 3083167
ranges from 1.362 (for the short 17 second exposure) to 5.711 (for the 160
second exposure), indicating that the apparent variability is due to
different levels of saturation.
See Use Case "Time-variable Phenomena - Search for Variable Stars in the dwarf irregular glaxy IC 1613" for a more detailed example of using the HSC to study variability.