
Mission Status Report #39 Star Date: December 5, 2000
FUSE Completes First Year of Science Operations!
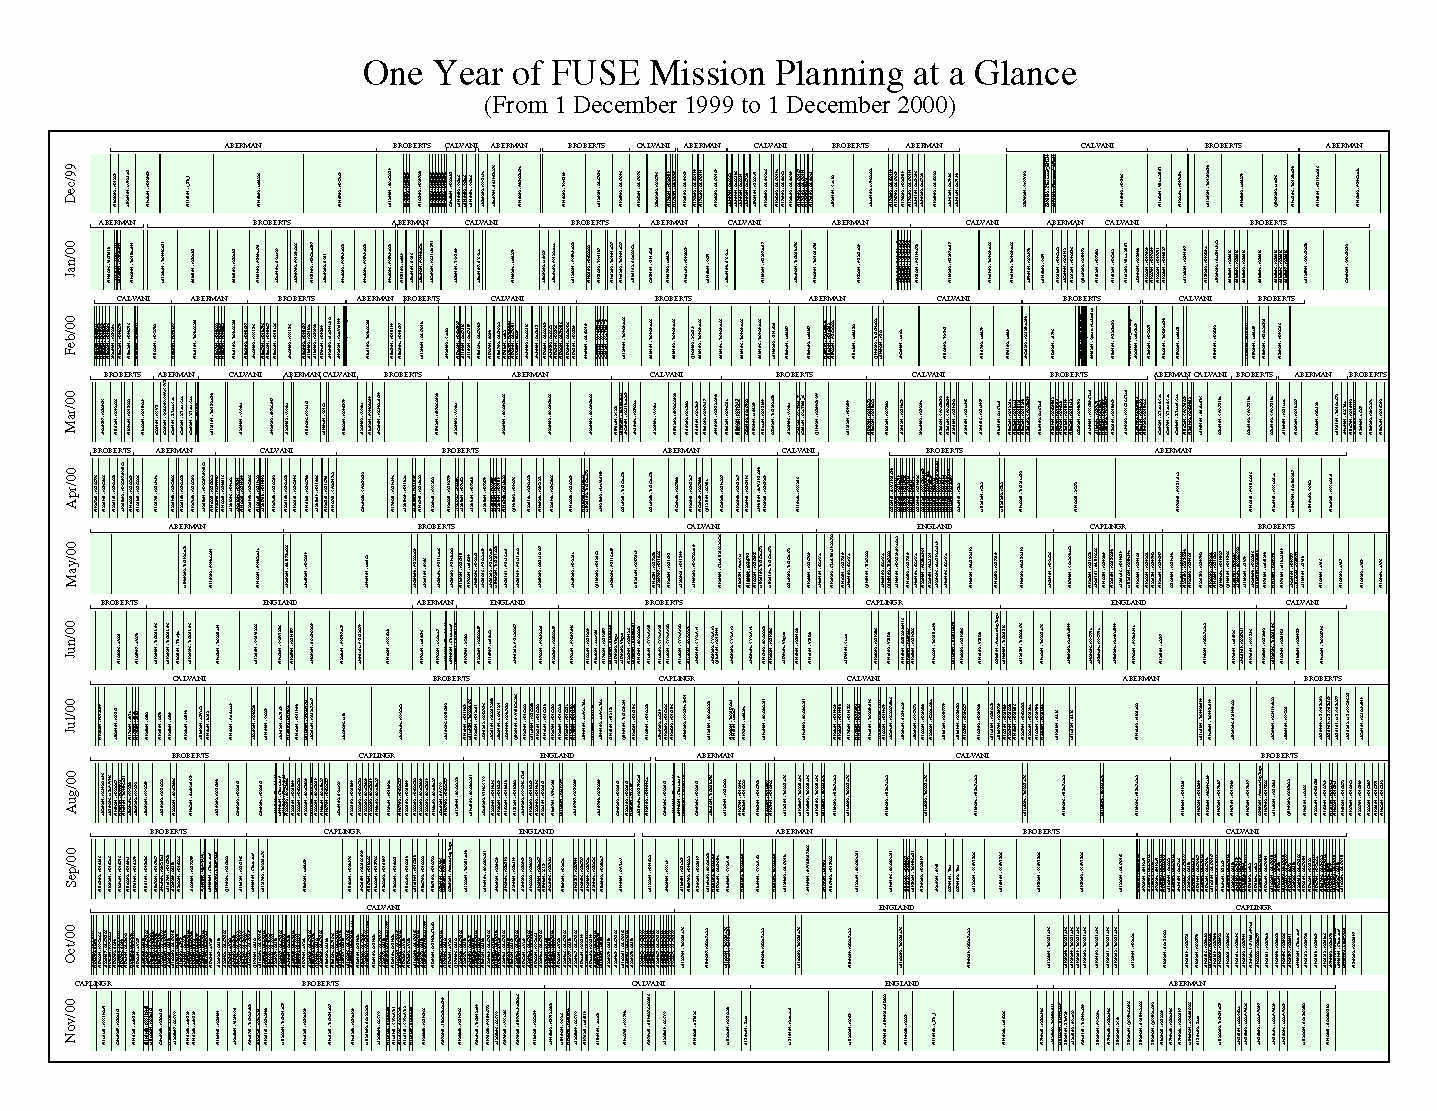
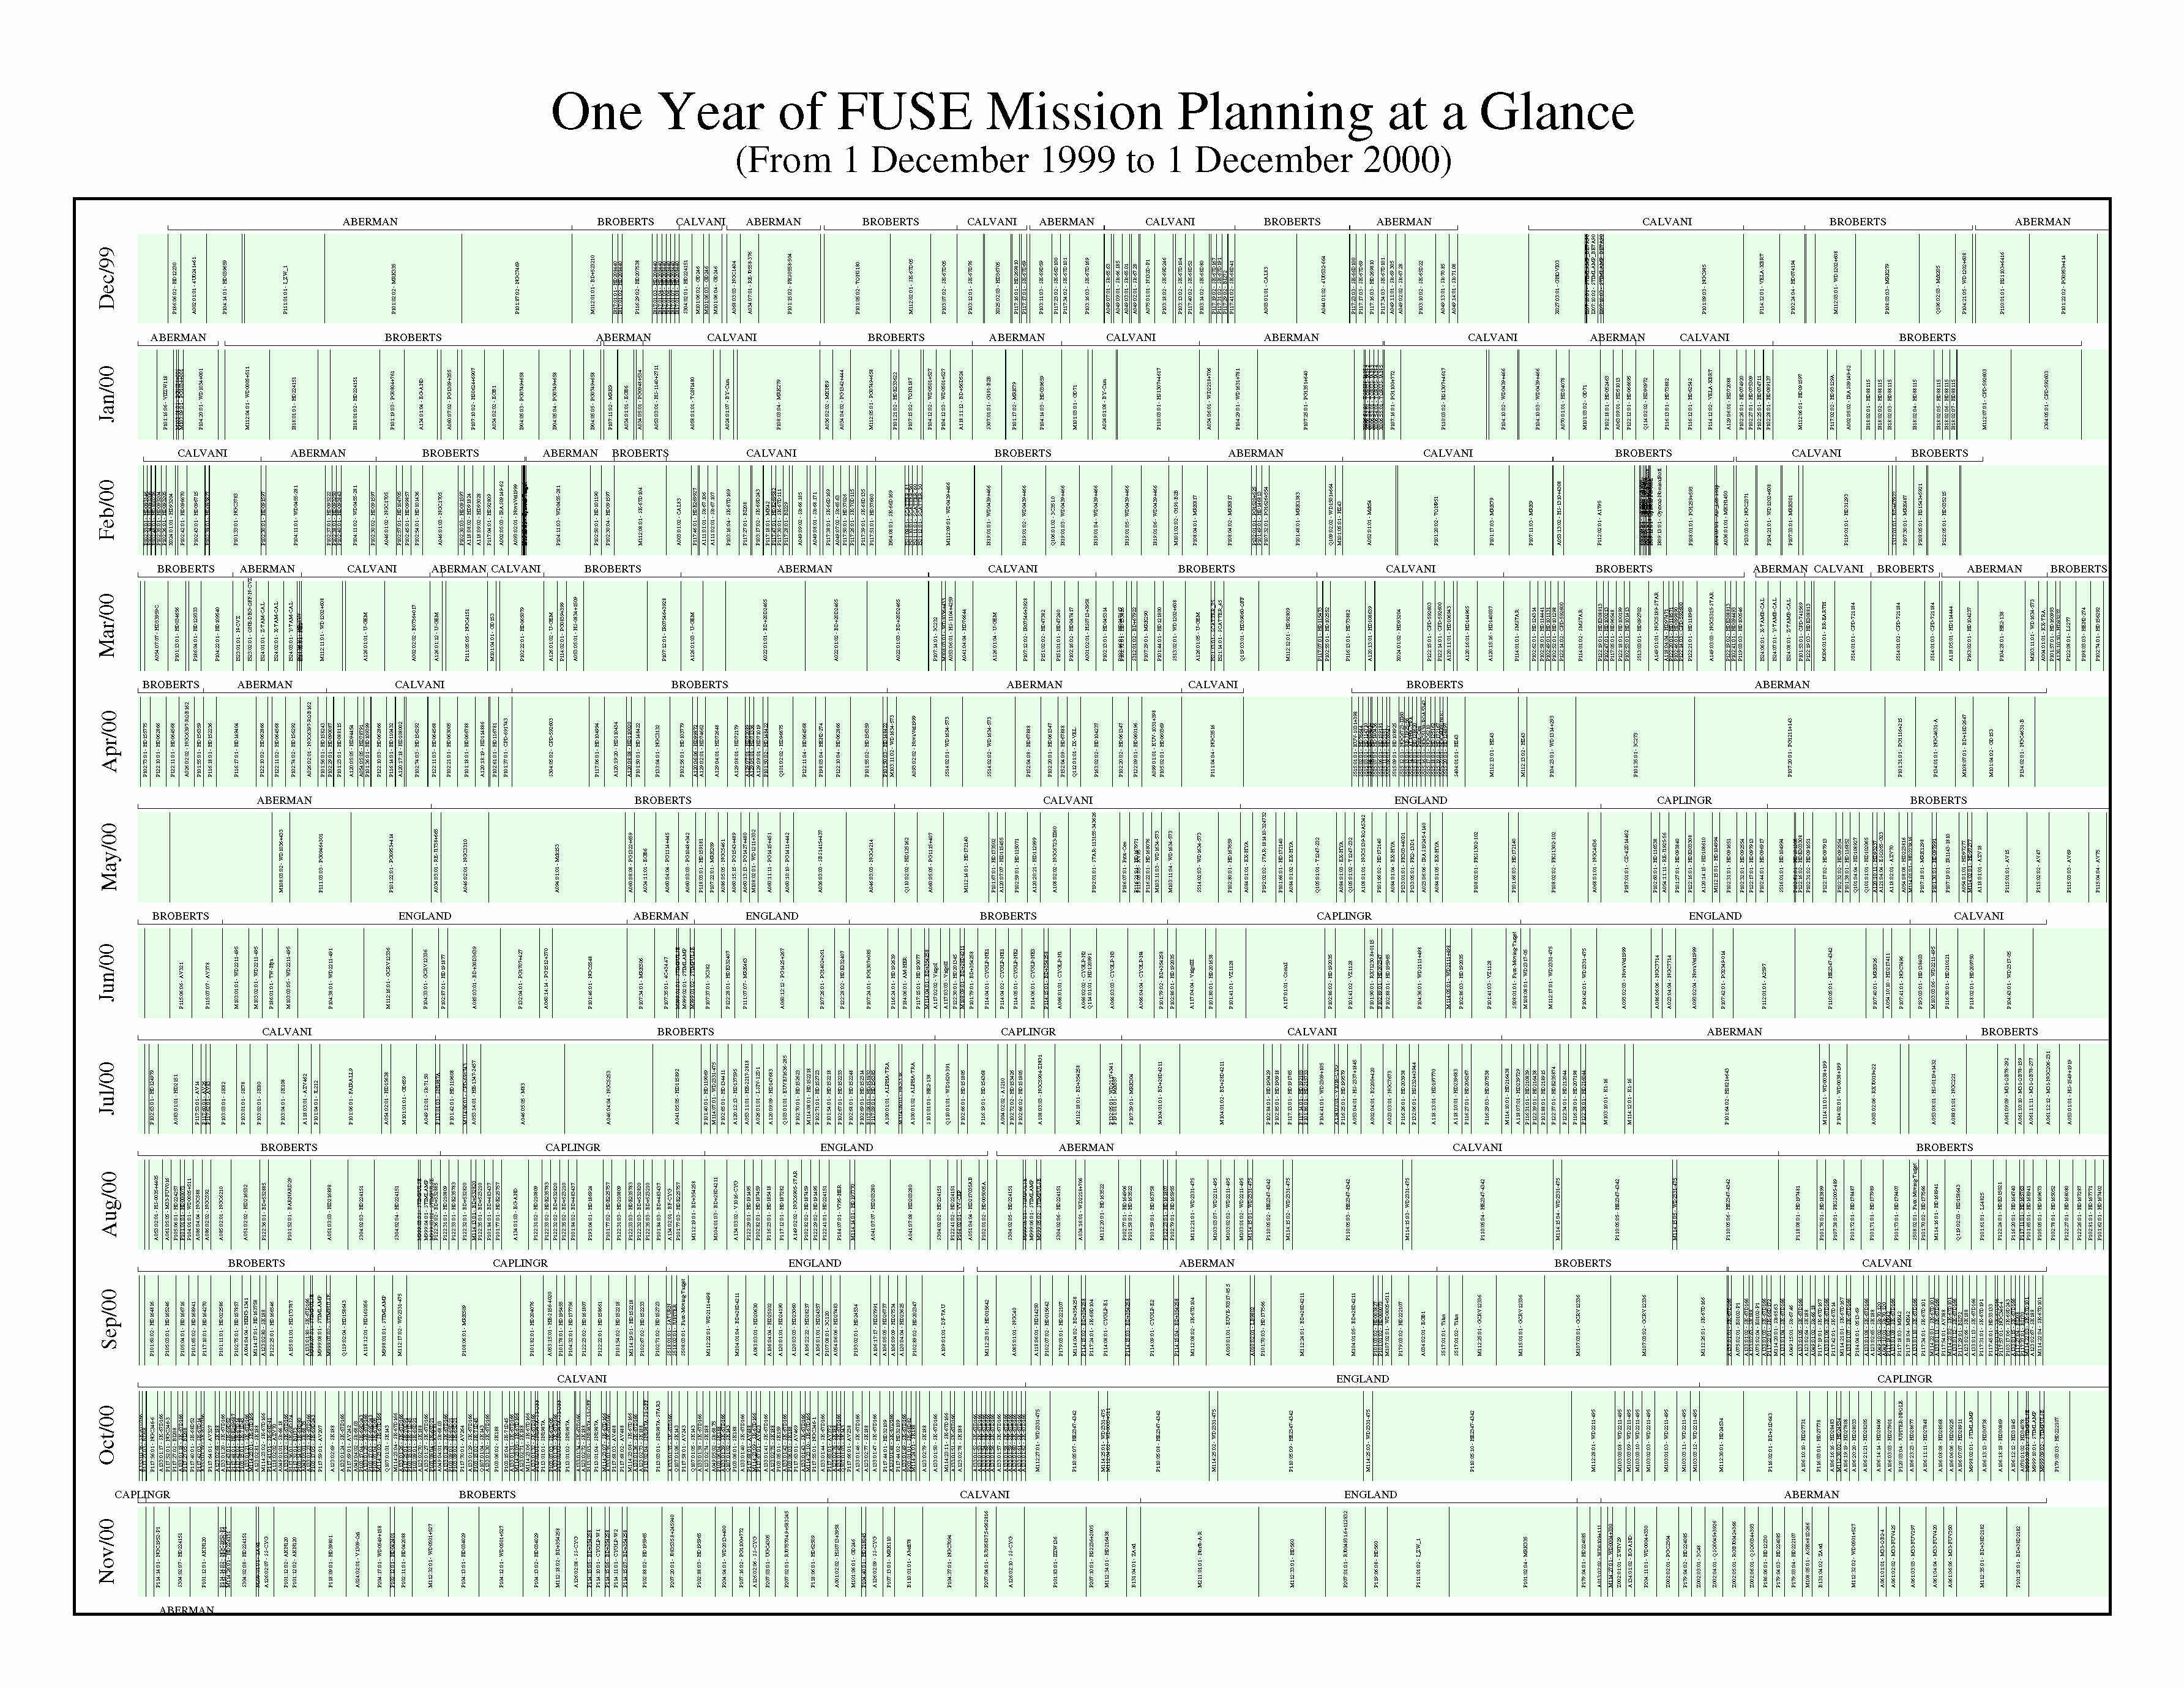
Caption: A whole YEAR of FUSE Science Observations on one plot! OK, I realize you can't read it, so click on the graphic above for a bigger version that is ALMOST legible (36 Kb jpeg)! Or, for a bigger version you can scroll around in and actually read, CLICK HERE! (But beware: 1.4 Mb jpeg!) [Plot courtesy of FUSE mission planner Bryce Roberts.] The graphic shows one month per horizontal line (starting with December 1999), and each line is blocked out into separate observations or activities. Even at the scale given above, you can see some interesting features, like the very busy set of observations done through the late September-early October period (when we were observing in the Magellanic Clouds), followed by some very long pointings of a faint quasar. Observations labelled with "Pxxx" are observations made for the Principal Investigator team, while those starting with "A" are are for Cycle 1 Guest Investigators. "M" programs are for calibration and alignment activities, and "Q" programs are for our French collaborators on the PI team.
(Click image above to see larger version.)
Hello World, All continues to go extremely well on the FUSE project, with the satellite hardware behaving nominally, and ground operations at JHU going smoothly. December 1 marked the first anniversary of official FUSE Science Operations, what we nominally called "Cycle 1." With a few days to reflect, I can summarize the results in some numbers:
As is often the case, however, the numbers don't tell the whole story. The numbers don't show the weekends worked, the midnight calls to fix some problem, or the incredible effort put forth by an extremely committed and dedicated team of scientists, engineers, and support staff to build, calibrate, and operate this satellite observatory. It is with great pride and admiration that I tip my hat to these folks, with a hearty "Congratulations!" for a job well done. On to Cycle 2!
Reported by: Bill Blair, Chief of Observatory Operations
|