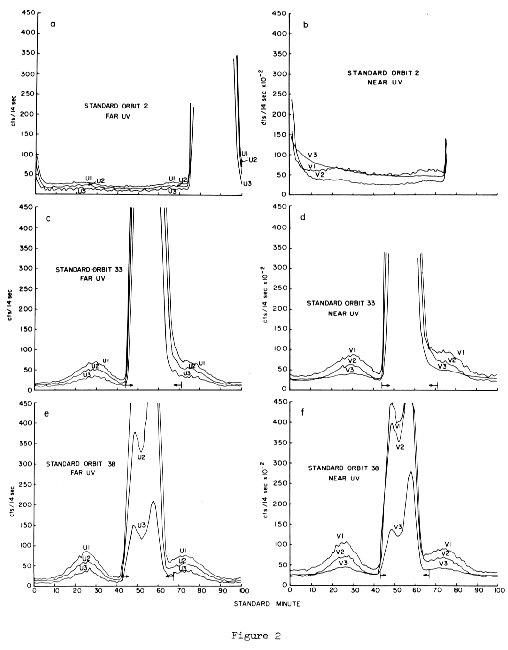
- Figure 2.
- Count rates as a function of time since the node crossing for standard
orbits 2, 33, and 38. Details are noted in the text. For each standard
orbit, the solar blind tubes U1, U2, and U3 are superimposed in the left
hand plot, while tubes V1, V2, and V3 are superimposed in the right hand
plot. Note in particular the different response of V3 relative to V2 and
V1 and the large fluctuations on V1 and V2.
Return to main paper.
