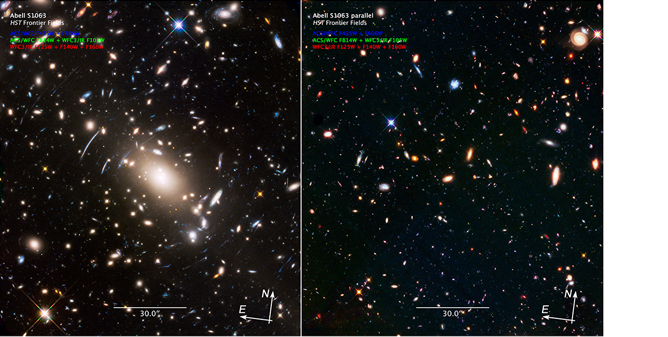
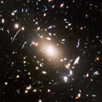
The most recent release of the cluster Abell S1063 from July 2016, incorporating the full depth of all ACS and WFC3/IR data obtained in the filters used for the Frontier Fields program, on both the main cluster (left) and its accompanying parallel field (right).The Frontier Fields program is a large Director's Discretionary program combining the power of Hubble, Spitzer, Chandra and other facilities to carry out ultra-deep observations of six lensing clusters and parallel deep blank fields, aiming to probe the faintest galaxies currently observable in the distant universe. The Hubble observations comprise a total of 840 orbits, consisting 140 orbits obtained with ACS (F435W, F606W, F814W) and WFC3/IR (F105W, F125W, F140W, F160W) on the main cluster and parallel fields for the six clusters Abell 2744, Abell 370, Abell S1063, MACS J0416.1-2403, MACS J0717.5+3745, MACS J1149.5+2223. The survey design paper by Lotz et al. (2016) was recently submitted to The Astrophysical Journal.
The High-Level Science Products for the program are all available through MAST, having been produced by the Frontier Fields team at STScI. These science-ready products include full-depth combined mosaics, astrometrically aligned to each other and to previously existing catalogs, as well as any archival data used for this program. The ACS mosaics incorporate the best available bias and dark current reference files, along with CTE correction and bias destriping. Also included are sets of mosaics that have been processed with the new selfcal approach to better account for the low-level dark current structure. The WFC3/IR mosaics have the best available removal of persistence and bad pixels, and in addition include a set of mosaics that have been corrected for time-variable sky emission that can occur during the orbit and can otherwise impact the up-the-ramp count-rate fitting if not properly corrected. All these high-level science products are delivered to the community through MAST (https://archive.stsci.edu/prepds/frontier/) on a rapid timescale to enable the widest scientific use of these data, as well as ensuring a public legacy dataset of the highest possible quality that is of lasting value to the entire community.
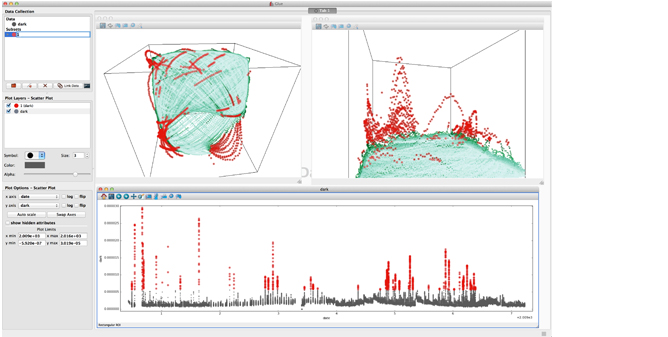
Example of vizualizing multidimensional data sets using Glue in the AstroConda environment.The Science Software Branch (SSB) at STScI has released a new distribution of the STScI science software environment, AstroConda. AstroConda utilizes the Anaconda distribution platform and provides many benefits over its predecessor, Ureka. Principle among these are a lightweight installation footprint, ease of use, highly customizable development environments, on-demand access to a vast number of third-party libraries, and improved software stability and sustainability.
Anaconda, the software distribution that AstroConda plugs into, provides the ability to install SSB software in a more modular fashion. Separate environments can be created with one of the supported Python versions (currently 2.7, and 3.5), into which any combination of the available packages can be installed. This could be as simple as a single library with dependencies or an entire metapackage of libraries bundled for specific goals such as data analysis, JWST pipelines, or HST pipelines.
IRAF and PyRAF continue to be included as available packages in AstroConda, and installation instructions can be found in the documentation linked below. However, as modern computer environments evolve, long-term support for IRAF becomes increasingly difficult. As a result, SSB will only be able to continue to provide IRAF so long as it can be built and run within a reasonable amount of effort.
Full information can be found at the AstroConda documentation pages. There you can find installation instructions, full package lists, and information about how to contribute.
The nominal 5 year mission of JWST mandates that the user community be able to perform robust scientific analysis and visualization from the very first day of operations. Though the JWST calibration pipelines will provide a thorough and robust calibration to the datasets, this will by necessity not address the specific needs of every possible science case. A more tailored re-calibration, as well as follow-up scientific studies, require users to be able to efficiently explore and analyze their datasets. Where the JWST calibration pipelines leave off with high-quality calibrated data, the data analysis tools pick up and provide a suite of both JWST specific and generalized tools to facilitate scientific investigations.
This toolkit is an evolving collection of stand-alone tools, algorithms, and libraries pertinent to JWST data and astronomical data analysis. Though the full-suite of tools will be even richer at launch, already included are spectral and image viewers, tools for general linked-dataset analysis, and libraries for photometry, spectroscopy, and image manipulation. These tools are being built predominantly in the Python programming language, hosted publicly on GitHub, and distributed in STScI’s Anaconda channel; AstroConda.
This effort is led by the Data Analysis Development Forum at STScI, but community involvement is both welcome and encouraged at all levels of this open-source project. To get involved, through code or even just ideas and input, please contact the mailing list at JWST_DADF@MAILLIST.STSCI.EDU. For the software installation, more information, links to the DADF, and other resources; please visit the JWST Data Analysis homepage. For a hands-on training session, consider attending our upcoming training workshop.
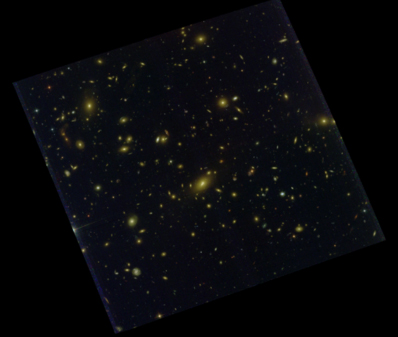
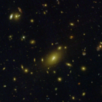
HST/ACS imaging of the galaxy cluster Abell 1300. The color image was constructed from imaging in F435W, F606W, and F814W filters.The Reionization Lensing Cluster Survey (RELICS; PI: Dan Coe, STScI) is an HST infrared imaging survey of 41 massive galaxy clusters. The primary objective is to search for brightly lensed high-redshift galaxies in preparation for the JWST Cycle 1 Call for Proposals. The RELICS targets include 21 of the 34 most massive known galaxy clusters as characterized by the Planck mission. The observations are conducted in two epochs to enable searches for supernovae, and use up to 8 NIR filters from ACS and WFC3. MAST has released the first five cluster fields, along with four of the associated parallel fields. The data include mosaics, three-color preview images, and source catalogs. For more information, visit the MAST webpage at https://archive.stsci.edu/prepds/relics/.
The MAST Discovery Portal allows users to search for data across all of MAST’s supported missions and the Virtual Observatory. Beyond providing access to these data, a number of tools enable users to view the data before downloading it to their machines, including generating scatter plots, catalog overlays, image cutouts, spectral plots, and light curves. This article will explain how to preview light curves in the Portal. Currently this includes mission-produced data from Kepler and K2, as well as a number of detrended K2 light curves provided by the community. For this demonstration, we will use the well-known transiting exoplanet TRES-2b.
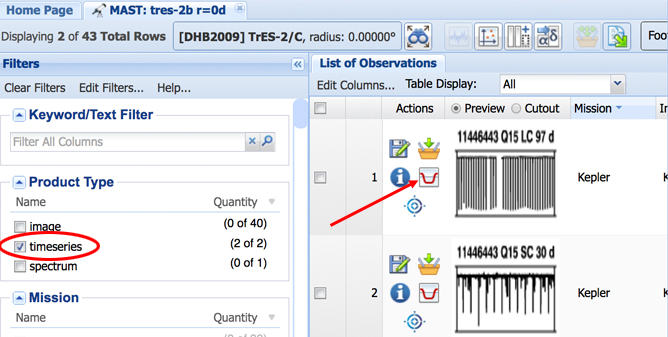
Fig 1: MAST Portal search results for Tres-2b. Select the "timeseries" data products and then click the "Timeseries Viewer" icon to view the light curve data.First we must locate the Kepler data for TRES-2b in the MAST archive. To do this, use the search in the box at the top of the Discovery Portal and enter “TRES-2b r=0d”. (The “r=0d” flag sets the search radius to zero degrees, since our target is a point source and we only want data that overlap exactly with its coordinates.) Make sure the “Select a collection…” box on the top-left is set to “All MAST Observations” (this is the default). After getting the search results, use the left panel to filter on a “Product Type” equal to “timeseries” (see Fig 1). This will give you two rows: the long- and short-cadence light curves from Kepler.
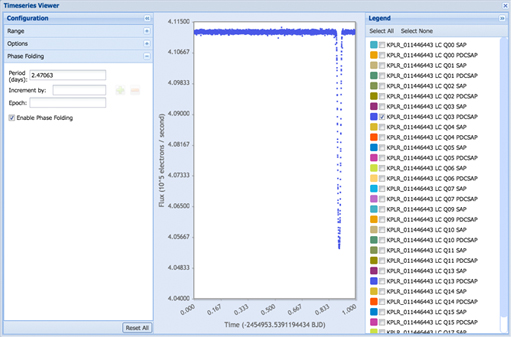
Fig 2: Timeseries Viewer window showing the Tres-2b PDCSAP data from Kepler Q3 phase-folded on a period of P = 2.47063 days.To view the time series data, click on the “Timeseries Viewer” icon (the u-shaped transit in red; see Fig 1), for the first row of returned results (the long-cadence data). Some short-cadence targets have too many data points to show in the Portal, hence why we restrict ourselves to the long cadence entry. A Timeseries Viewer window will appear (see Fig 2) and display the first data set for this target. Each timeseries can have a different structure: in the case of Kepler, there are separate data series for each Quarter and for both the Simple Aperture Photometry (SAP) and the PDC-corrected SAP. You can plot any of the data sets by selecting them using the right panel. The left panel allows you to manipulate the plot (change axis zoom, smooth the time series, and even phase-fold the data on a period and epoch. Have requests or suggestions for more options? Send them our way by emailing archive@stsci.edu or post on the MAST forum.
This newsletter is a MAST publication produced by Jonathan Hargis, on behalf of the entire MAST staff, who welcome your comments and suggestions.
The Mikulski Archive for Space Telescopes (MAST) is a NASA funded project to support and provide to the astronomical community a variety of astronomical data archives, with the primary focus on scientifically related data sets in the optical, ultraviolet, and near-infrared parts of the spectrum. MAST is located at the Space Telescope Science Institute (STScI).