


 Follow Us
The Multimission Archive at STScI Newsletter
| August 1, 2007 | Space Telescope Science Institute | Volume 19 |
| The Multimission Archive at STScI (MAST) Newsletter disseminates information to users of the HST, FUSE, GALEX, IUE, Copernicus, EUVE, HUT, UIT, WUPPE, HPOL, IMAPS, BEFS, TUES, VLA-FIRST, and XMM-OM data archives supported by MAST. Inquiries should be sent to archive@stsci.edu. |
Table of Contents

|
The Hubble Legacy Archive - Open for Business |
The Hubble Legacy Archive (HLA) is an augmentation of the Hubble Space Telescope (HST) data archive service. The goal is to optimize the science coming from the telescope by providing better browsing capabilities and easy access to enhanced products. The project is a collaboration between the Space Telescope Science Institute (STScI), the European Coordinating Facility (ST-ECF) and the Canadian Astronomy Data Centre (CADC). One of the primary goals of the project is to make HST data VO (Virtual Observatory) compatible.
Some of the primary enhancements for image data include:
- Putting the data online for immediate access
- Adding a footprint service to make it easier to browse and download images
- Providing more extensive "composite images" (e.g., stacked, color, mosaics)
- Improving absolute astrometry (i.e., from ~ 1-2" to ~ 0.3") when there is sufficient overlap with the Guide Star Catalog 2 (GSC2)
- Developing source lists
The URL to access the HLA is: http://hla.stsci.edu.
We are currently in the Early Data Release phase of the project (e.g., the HLA includes ~25% of the ACS data), with the more formal Data Release-1 planned for the Fall. The user interface system is still somewhat rudimentary, hence we warn users that they might run into some rough edges. We would appreciate your help in testing the system and providing feedback by sending us a quick e-mail with any problems or provide us suggestions. This will help us prioritize our work so that we spend our effort on the most important modifications.
As part of this Early Data Release, ST-ECF is providing a sample of NICMOS grism extractions (~ 10 % of the available G141 data) http://hla.stecf.org/archive/hla/. Please see the article in the July 2006 ST-ECF Newsletter for more information about this project.
Here are a few HLA essentials. Please consult the HLA HELP page (especially the FAQ) for more details.
HLA ESSENTIALS
The current HLA data release has the following limitations:
- The HLA only runs using FIREFOX or a compatible browser.
- The HLA currently contains only ~25 % of the ACS data (mainly data from
2002 - 2003). The data can be viewed in one of three ways:
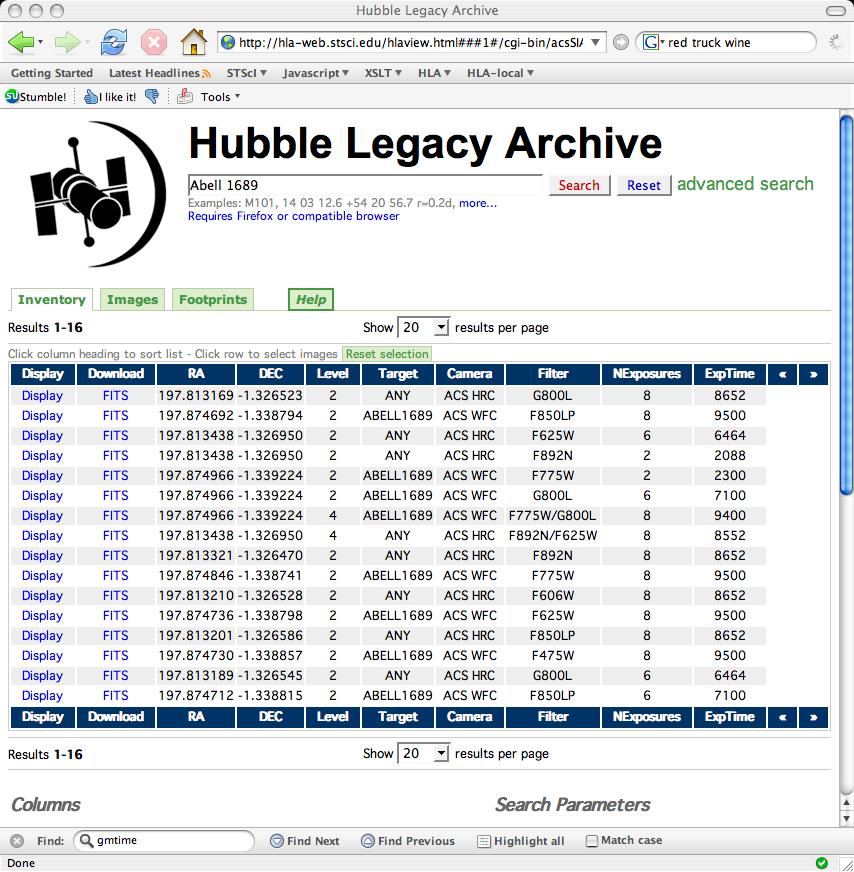
- INVENTORY, a tabular format
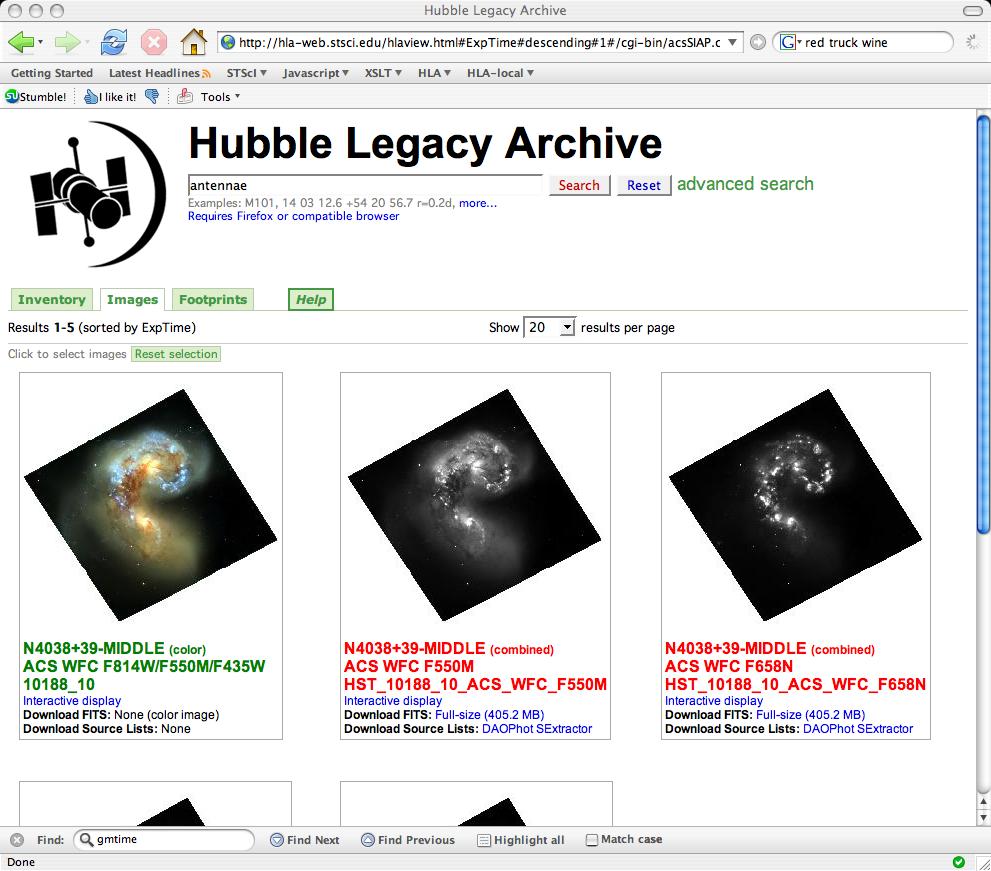
- IMAGES, an array of preview images and an interactive quick-look display
- FOOTPRINTS, an outline of the detector field of view overlaid on a DSS image.

Screen Shot showing inventory table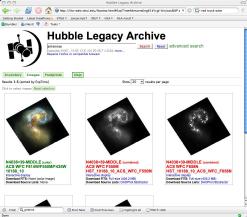
Screen Shot showing images page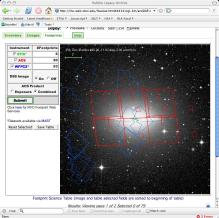
Screen Shot showing footprints pageClick on images to see full-sized screen shot - Most WFPC2 (prior to September 2006) and STIS (prior to August 2004)
observations are shown in the FOOTPRINTS, but the data are not
contained in the HLA database. Hence they will not show up in the INVENTORY
or
IMAGES. These data can be retrieved from MAST in the normal manner.
- Only non-proprietary ACS data taken BEFORE JANUARY 1, 2006 is currently (July, 2007) included in the HLA.

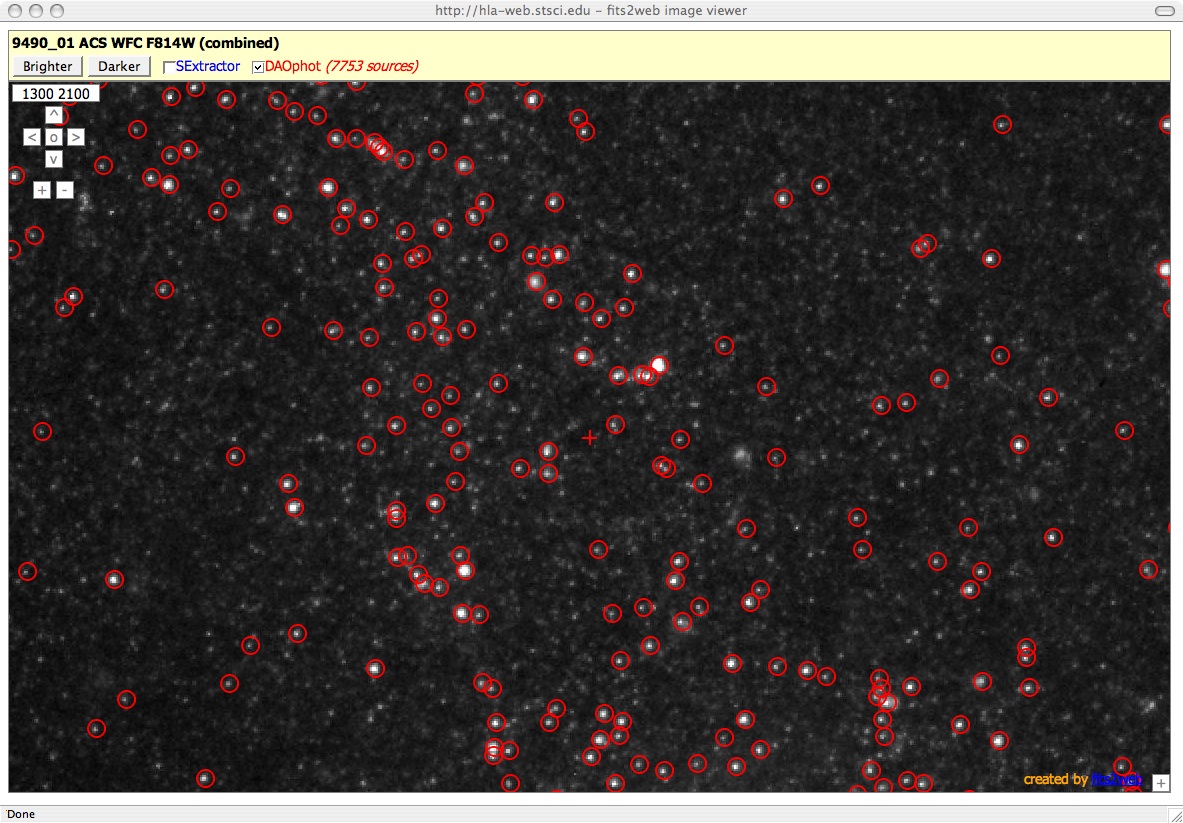
| The HLA images are combined using the multi-drizzle software which is used in the normal HST calibration pipeline. Some of the differences are that we improve the absolute astrometry when possible by cross-correlating with the GSC2 catalog (this is possible for ~ 80 % of the images), we align the image with north up to make comparison with other datasets easier, and we combine some datasets that the normal HST pipeline does not (e.g., when POS TARGs are used to dither the observations). Two source lists are provided for many images. The first uses DAOPHOT, which is best for finding point-like sources. The second uses SEXTRACTOR, which is best for extended sources. Note that these are general use source lists; researchers will generaly need to make their own catalogs to optimize the particular science they are interested in. |
HLA Source List Overlaid on M101 |
Future enhancements to the HLA include:
- providing "ACS-like" products for the WFPC2 (e.g., cosmic-ray rejected, multi-drizzle combined images;) the Canadian Astronomy Data Centre is taking the lead in developing these products
- providing similar products for NICMOS, and STIS imaging
- providing spectroscopic data and quick look tools.
Thanks for helping us exercise the system. We are looking forward to your feedback.
How to find exposure times for members of HST associations
The archive help desk occasionally receives questions regarding how to find the exposure times for the individual HST exposures (aka members) in a given association (aka product). The information does exist in the HST catalog, but one must use Starview to access it. Starview is a Java application that you may need to load onto your computer. It is available at: http://starview.stsci.edu/html/. We plan to add the capability to see members and member exposure times from the web interface, but until that is completed this technique is required. In addition, the technique is limited to data from one instrument at a time. Also note that for many instruments, the exposure start and end times are given as Modified Julian Dates. The exposure time is given in seconds.
Use the following steps to add exposure level information to a standard (General Search or Quick Search) Starview Search screen.
| 1. Start starview. | |
| 2. Under the Searches menu (not the binoculars), select HST, then either Quick Search or General Search. This will bring up the Search screen. |
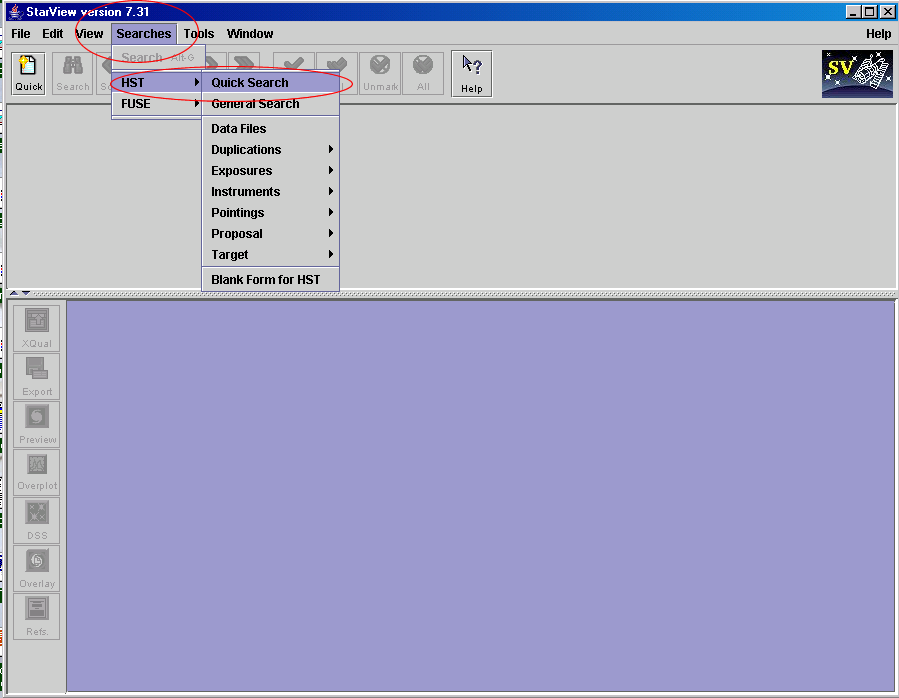
Screen shot illustrating Searches/Quick Search option. Click on thumbnail to see full size image. |
| The Search screen has 2 sections. The upper section, into which you put information to "qualify" your search, and the lower section, which will show the results. At the bottom of the lower section are some buttons. The first reads STATIC. Click on it so it reads EDIT. This is necessary to allow the addition of more fields to the page. |
Screen shot illustrating upper/lower sections and STATIC/EDIT button |
| 3. From the menu bar at the top of the screen, select View -> Custom Query Generator. A separate screen will appear. It is from this screen that fields are selected to add to the Search screen. You may have to move screens around, as the original screen wants to remain on top. |
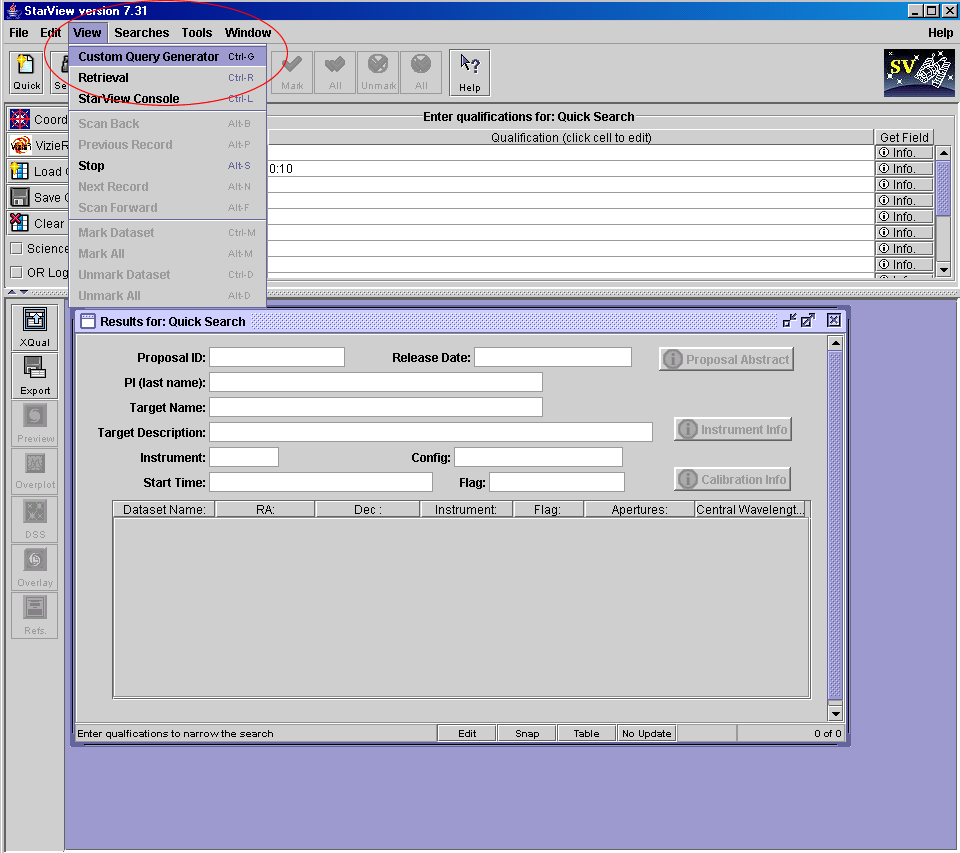
Screen shot illustrating Custom Query Generator |
|
4. In the Custom Query screen, click on the TABLE icon at the top of
the screen. This assumes you are searching for many datasets, so the
results will need to be tabular, not a single item.
In the lower portion of the Custom Query screen is the database structure. From the database structure, individual fields will be selected for display on the Search Form |
Screen shot illustrating Custom Query Generator |
|
5. In the Database Structure, click on the lever next to catalog.
Depending on which instrument you are interested in, click on
acs_a_data, nicmos_a_data or stis_a_data. The fields will be
displayed for that table. For ACS and NICMOS, select
<si>_data_set_name, <si>_expstart, <si>_expend and <si>_exptime,
where <si> is aca (ACS) or nsa (NICMOS). For STIS, select ssa_program_id,
ssa_obset_id, ssa_obsnum, ssa_expstart, ssa_expend, ssa_exptime. For
STIS, concatenate ssa_program_id, ssa_obset_id and ssa_obsnum to
get the rootname, less the trailing character, of the exposure.
As you do this, you will notice these items appearing in both the upper and lower sections of the Search screen. The results will appear in the table in the lower portion of the screen. To adjust the size of the table, right click on any of the column titles and select Properties... |
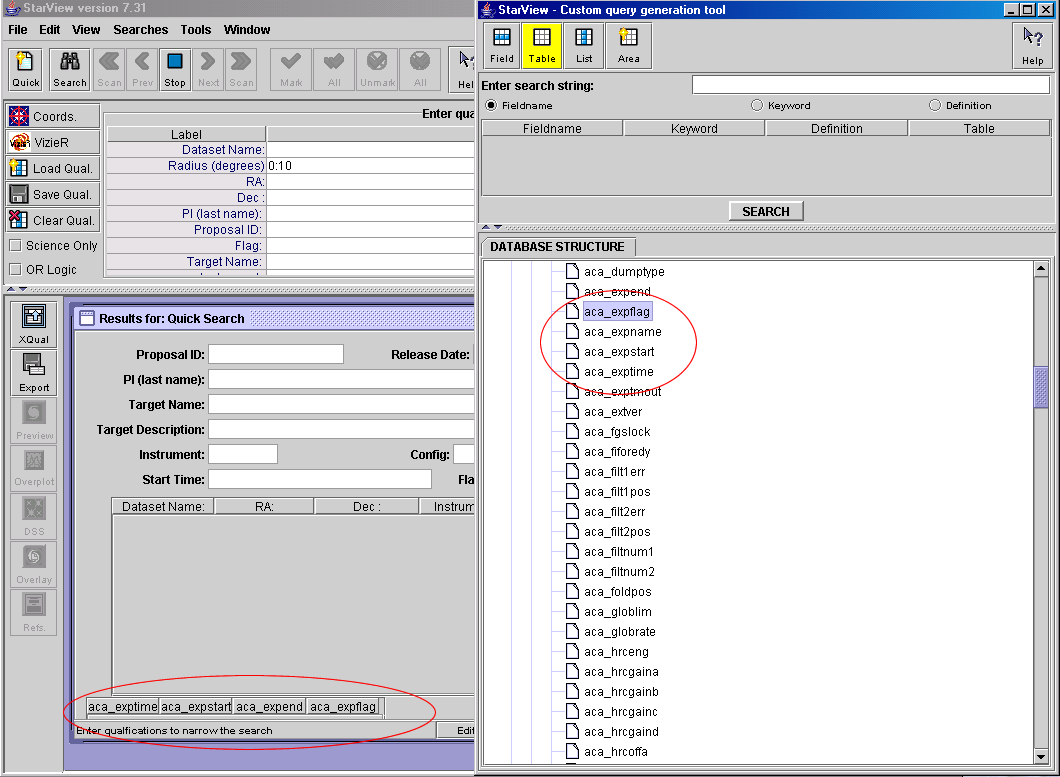
Screen shot illustrating selection of fields. |
| 6. When you are done adding items, return to the Search form by clicking on it. Qualify your search by entering items in the upper portion of the Search screen. Fields can be left blank. The wildcard is a %. |

|
|
7. Initiate the search by clicking on the SEARCH icon (the binoculars).
The results will appear in the lower portion of the Search screen.
Examine the Results screen (the lower portion of the screen). There
are 3 main boxes on the General Search screen and 2 boxes on the Quick
Search screen that contain results. Clicking on a record in any one
box highlights the "clicked" record AND the corresponding records in
the other box(es). Note that the center box on the General Search screen
(top box on the Quick Search screen) contains multiple records
for each association - one record for each member (exposure) of the
association. Click on an association record and the exposure (member)
will be highlighted in the other boxes, including the table of added fields
created by the procedure.
The records in each box can be sorted by right clicking on the column heading
and selecting sort by column. It is recommended that the records be sorted
by Dataset Name so that all records for a given association are listed
sequentially.
The modified Search screen can be saved so it will be available for future searches. Click on the File menu, then save local form. A dialog box will pop up that allows you to specify a name and location for the saved screen. |
|
MAST User Survey Results
 MAST conducted a User Survey in May, 2007 to gather information that helps us support our
users' needs and to prioritize our plans for improving and expanding at MAST. We
thank the 366 respondents who took the time to reply. We especially appreciate the
comments and suggestions. We have
summarized the results of the survey and also
included a response
to some of the comments and suggestions.
MAST conducted a User Survey in May, 2007 to gather information that helps us support our
users' needs and to prioritize our plans for improving and expanding at MAST. We
thank the 366 respondents who took the time to reply. We especially appreciate the
comments and suggestions. We have
summarized the results of the survey and also
included a response
to some of the comments and suggestions.
We responded to those of you who left email addresses. Due to the short nature of the survey
response form, there were responses we did not fully understand and so could not address.
If you do not see a response or have a further comment, please get in touch with us. We really
are interested in addressing your comments. Please send mail to
archive@stsci.edu or visit our
suggestions page. Be sure to leave your email address
so we can clarify any questions that might arise.
MAST Users Group Summary
| In June 2007, the MAST Users Group (MUG) met at STScI. This group meets annually to provide feedback from the user's perspective. They help us to set priorities for operational and scientific enhancements to the archive and provide suggestions for new capabilities. This year's members were Leonidas Moustakas (Chair, JPL/Caltech), Jeff Newman (LBNL Berkeley), Sandyha Rao (University of Pittsburgh), Richard Wade (Penn State), Duilia De Mello (GSFC/JHU), and Christine Chen (NOAO). All the presentations of this year's meeting and the previous years can be found at http://archive.stsci.edu/mug. The final MUG report will be added to the page once received from the MUG. |
|
Community Contributed High-Level Science Products
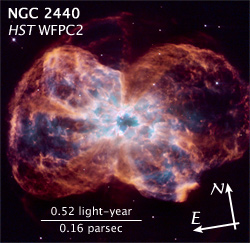
NGC 2440
 Following the failure of the "backup" side 2 electronics on the Advanced
Camera for Surveys (ACS) on 27 January 2007, the Hubble Heritage Team was
asked to conduct some new high-quality multiwavelength WFPC2 observations
(proposal 11090). Although the WFPC2 has been in continuous service since
being installed during Hubble Servicing Mission 1 in 1993, it has only had
limited use since the installation of ACS during HST Servicing Mission 3B
in 2002. The purpose of this was to quickly illustrate the current WFPC2
data quality, and produce a Heritage-quality color composite image. A
secondary goal was to demonstrate the best practices for WFPC2 pointing
and drizzling, and to provide a concrete A-to-Z example to help guide ACS
users currently converting their science programs to WFPC2. The Heritage
Team demonstrates in this dataset the improved resolution that is possible
when WFPC2 observations are made with optimal sub-pixel dithering. Science
Ready data products of NGC 2440 and links for best practices for WFPC2
pointing and drizzling are now available through the MAST archive at
http://archive.stsci.edu/prepds/heritage/ngc2440/index.html.
Following the failure of the "backup" side 2 electronics on the Advanced
Camera for Surveys (ACS) on 27 January 2007, the Hubble Heritage Team was
asked to conduct some new high-quality multiwavelength WFPC2 observations
(proposal 11090). Although the WFPC2 has been in continuous service since
being installed during Hubble Servicing Mission 1 in 1993, it has only had
limited use since the installation of ACS during HST Servicing Mission 3B
in 2002. The purpose of this was to quickly illustrate the current WFPC2
data quality, and produce a Heritage-quality color composite image. A
secondary goal was to demonstrate the best practices for WFPC2 pointing
and drizzling, and to provide a concrete A-to-Z example to help guide ACS
users currently converting their science programs to WFPC2. The Heritage
Team demonstrates in this dataset the improved resolution that is possible
when WFPC2 observations are made with optimal sub-pixel dithering. Science
Ready data products of NGC 2440 and links for best practices for WFPC2
pointing and drizzling are now available through the MAST archive at
http://archive.stsci.edu/prepds/heritage/ngc2440/index.html.
Jupiter
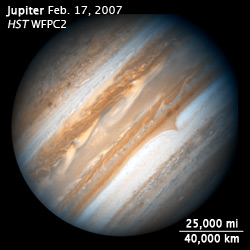 The New Horizons spacecraft was launched on January 19, 2006, and conducted
observations of Jupiter during the February 28, 2007 encounter. In support
of this flyby, two Hubble Space Telescope (HST) General Observer (GO)
proposals were approved: 10862 (PI John Clarke) and 10871 (PI John
Spencer). Following the failure of the ACS side 2 (backup) electronics on
January 27, 2007, STScI Director Matt Mountain granted 20 orbits of his
discretionary time to the Hubble Heritage Team to conduct additional
Jupiter observations with WFPC2 (program 11096). Working closely with the
New Horizons science team to design complementary observations, the
Heritage Team conducted a sequence of multiwavelength observations over a
full Jupiter "day" (~10 hours), to globally map the Jovian cloud structure
at the time of the flyby, and then repeat this sequence again 3 weeks
later. Other observations include a transit of Io (with an active Tvashtar
volcanic plume), and some sequential observations of the Great Red Spot
and Little Red Spot. More information and the data can be found at
http://archive.stsci.edu/prepds/heritage/jupiter/index.html.
The New Horizons spacecraft was launched on January 19, 2006, and conducted
observations of Jupiter during the February 28, 2007 encounter. In support
of this flyby, two Hubble Space Telescope (HST) General Observer (GO)
proposals were approved: 10862 (PI John Clarke) and 10871 (PI John
Spencer). Following the failure of the ACS side 2 (backup) electronics on
January 27, 2007, STScI Director Matt Mountain granted 20 orbits of his
discretionary time to the Hubble Heritage Team to conduct additional
Jupiter observations with WFPC2 (program 11096). Working closely with the
New Horizons science team to design complementary observations, the
Heritage Team conducted a sequence of multiwavelength observations over a
full Jupiter "day" (~10 hours), to globally map the Jovian cloud structure
at the time of the flyby, and then repeat this sequence again 3 weeks
later. Other observations include a transit of Io (with an active Tvashtar
volcanic plume), and some sequential observations of the Great Red Spot
and Little Red Spot. More information and the data can be found at
http://archive.stsci.edu/prepds/heritage/jupiter/index.html.
Announcements and Status
Coming Soon
- New Web Server
The MAST web server will soon be upgraded to a faster more powerful server. A presentation given to the MAST Users Group in June gives some of the details. We hope that the server will be deployed by mid-August, but deployment may be delayed to coincide with the next DADS/OPUS release in early September to minimize downtime. We expect the MAST website to be down for a day for deployment and testing. We will announce the deployment day on the website once it is set. - STIS Data Recalibration Complete and Data Will Be Added to HSTONLINE
The final recalibration of all existing STIS data has been essentially completed. A summary of the enhancements was included in the January 2007 MAST Newsletter as well as in the Fall 2006 STScI Newsletter. A few observations still remain to be reprocessed, but await additional software modification that will be installed in the next OPUS/DADS build, in early September. On-the-fly-reprocessing (OTFR) for STIS data was turned off in June 26, 2007, so all DADS requests for STIS data are filled from a static cache of files.As the STIS data were reprocessed, the files were copied to the ftp area attached to the new web server. After deployment of the new web server, the STIS data will be included in the HSTONLINE interface. As with the FOS, GHRS, and FOC data already accessible from the HSTONLINE interface, the STSI data will also be available via anonymous ftp.
ftp archive.stsci.edu
Sign on as anonymous or with your archive username and password
cd /pub/hstonline/XXXX/xxxxxxxxx/ where XXXX are the first 4 characters of the dataset name and xxxxxxxxx is the dataset name.You can also see these data through your browser at http://archive.stsci.edu/pub/hstonline/XXXX/xxxxxxxxx/
We anticipate that eventually all HSTONLINE data will be included in the Hubble Legacy Archive, probably beginning with the STIS data.
- XMM-OM Enhancements
In April 2007, the XMM Optical Monitor Data archive available from MAST was updated and augmented. New data includes more recent observations as well as data from observations made with different modes. Additional information is available concerning the OM instrument and the processing and catalogue creation. Additional data will be made available upon deployment of the new server.
Status
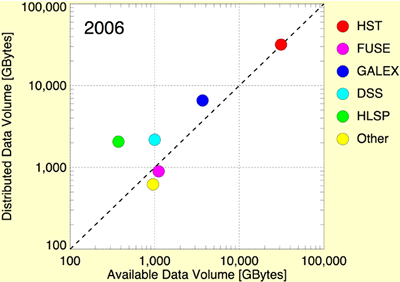 The MAST archive held nearly 50 TB of mission data having expanded by nearly 4 TB since January 2007.
Since January 2007, more than 24 TB of data were distributed.
The plot to the right shows the volume of data holdings for each set of data as of May 31, 2007
vs the volume data distributed for that dataset between June 1 2006 and May 31 2007.
You can see that the Community-Contributed High Level Science Products (HLSP) are quite popular.
More data was distributed than is held for Digitized Sky Survey (DSS) data and GALEX data, while the
volume of HST data distributed is nearly equal to the amount held.
The MAST archive held nearly 50 TB of mission data having expanded by nearly 4 TB since January 2007.
Since January 2007, more than 24 TB of data were distributed.
The plot to the right shows the volume of data holdings for each set of data as of May 31, 2007
vs the volume data distributed for that dataset between June 1 2006 and May 31 2007.
You can see that the Community-Contributed High Level Science Products (HLSP) are quite popular.
More data was distributed than is held for Digitized Sky Survey (DSS) data and GALEX data, while the
volume of HST data distributed is nearly equal to the amount held.
|
MAST is continually looking for ways to help you find the data you want
and we would really like to hear your ideas.
We have provided a "suggestion box" at
http://archive.stsci.edu/suggestions.html
and encourage you to post suggestions, comments and concerns through this interface.
A link to the suggestion box is found on the second line of the top menu on most MAST web pages.
Some past users have allowed us to post their suggestions. Those suggestions and the MAST responses can be found at http://archive.stsci.edu/suggestion_response.html. |

|
Let us hear from you!
To Subscribe or Unsubscribe to the Newsletter
If you would like remove yourself from the mailing list send mail to archive_news-request@stsci.edu and put the single word unsubscribe in the BODY of the message. Information on the subject line will be ignored.If you would like to subscribe to the mailing list to receive notification of future Archive Newsletters, send mail to archive_news-request@stsci.edu and put the single word subscribe in the BODY of the message. Information on the subject line will be ignored. You will be asked to confirm the subscription.